


















 The 10 most alternative cities in South America
Discover South America's top 10 alternative cities! From Valparaíso's vibrant streets to La Paz's high-altitude charm and Medellín's innovative spirit.
On this page you will find more information about the mean monthly wind speed over the year in Paulínia (São Paulo State), Brazil.
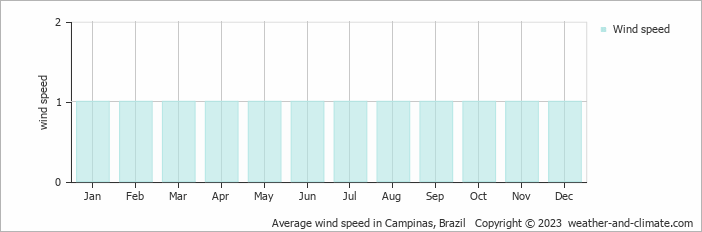
Throughout the year, wind speeds in Paulínia average from 1 m/s (2 knots) and increase to 1 m/s (2 knots).
The 1 m/s (2 knots) average in January, February, March, April, May, June, July, August, September, October, November and December means predominantly still conditions throughout the month. Some days will be completely calm while others may experience a bit more wind. In general this minimal wind speed is barely perceptible on skin. In terms of speed conversion, it represents 3.6 kilometers per hour or 2.2 miles per hour.
The Beaufort scale categorizes this as "light air." Smoke patterns show nearly vertical rise with slight occasional drift. Tree leaves remain generally undisturbed, with only rare gentle rustling. Wind becomes a non-factor for most activities during these tranquil months.
For more detailed information about Paulínia’s weather, including monthly rainfall, sunshine hours, and humidity levels, visit our Paulínia climate page.
Pick a month to see the average temperature, rainfall and sunshine in Paulínia - and find the best time to visit.
Temperature Rainfall Sunshine Humidity Wind Speed
See the full Paulínia climate overview or explore weather in Brazil.
Where to go in September - average daytime high across popular destinations.
Need travel inspiration? Check out our bucket list articles and be inspired.
The 10 most alternative cities in South America
Discover South America's top 10 alternative cities! From Valparaíso's vibrant streets to La Paz's high-altitude charm and Medellín's innovative spirit.

 The 5 most tranquil retreats in the Amazon Rainforest, Brazil
Discover top sustainable lodges in the Amazon. Enjoy unique wildlife, eco-friendly stays, and immersive experiences at Anavilhanas, Cristalino, and more.
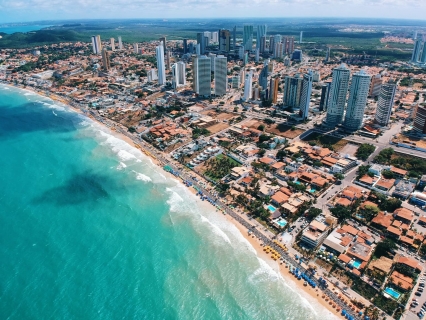 Brazil in November: Where Is the Best Weather?
Discover where Brazil has the best weather in November, comparing Fortaleza, Salvador, Rio, São Paulo, Florianópolis, Brasília and Foz do Iguaçu.
 An alternative way to discover Rio de Janeiro
Don't feel like seeing the traditional tourist sights in Rio de Janeiro? We have made an overview of the sights in Rio de Janeiro that you must see if you want to visit Rio in an alternative way.