















 A paradise called Andaman Islands
Though officially Indian, the Andamans are nearer Myanmar, Indonesia, and Thailand, resulting in amazing, budget-friendly white-sand beaches.
On this page you will find more information about the mean monthly wind speed over the year in Manglutān (the Andaman Islands), India.
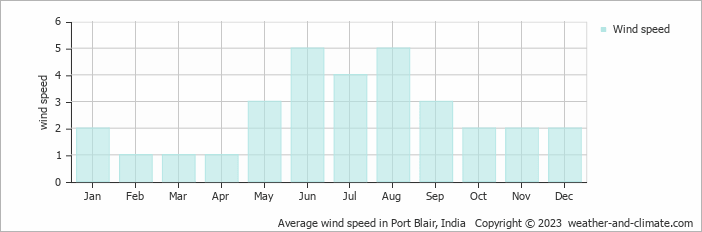
Annually, wind speeds in Manglutān vary between 1 m/s (2 knots) at their lowest and 5 m/s (10 knots) at their peak.
The 1 m/s (2 knots) average in February, March and April means predominantly still conditions throughout the month. Some days will be completely calm while others may experience a bit more wind. In general this minimal wind speed is barely perceptible on skin. In terms of speed conversion, it represents 3.6 kilometers per hour or 2.2 miles per hour.
The Beaufort scale categorizes this as "light air." Smoke patterns show nearly vertical rise with slight occasional drift. Tree leaves remain generally undisturbed, with only rare gentle rustling. Wind becomes a non-factor for most activities during these tranquil months.
However, June and August experiences average wind speeds of [5 m/s]. This means most days feature persistent breezes that cause large branches to sway and dust to blow around. The wind creates noticeable resistance. This speed translates to 18 kilometers per hour or 11.2 miles per hour. While intensity may vary at times, consistently windy weather is typical during this period. It's an ideal time for kite and windsurfing enthusiasts.
For more detailed information about Manglutān’s weather, including monthly rainfall, sunshine hours, and humidity levels, visit our Manglutān climate page.
Pick a month to see the average temperature, rainfall and sunshine in Manglutān - and find the best time to visit.
Temperature Rainfall Sunshine Humidity Wind Speed Water Temp
See the full Manglutān climate overview or explore weather in India.
Where to go in October - average daytime high across popular destinations.
New Delhi 34°C (93°F) Gurugram
 34°C (93°F) Jaipur35°C (95°F) Mumbai
 32°C (90°F) Hyderabad31°C (88°F) Chennai
 32°C (90°F) Bengaluru
 29°C (84°F) Kochi29°C (84°F)
 Need travel inspiration? Check out our bucket list articles and be inspired.
A paradise called Andaman Islands
Though officially Indian, the Andamans are nearer Myanmar, Indonesia, and Thailand, resulting in amazing, budget-friendly white-sand beaches.
 The 5 most beautiful monasteries in Ladakh
Explore Ladakh's spiritual essence through its incredible Buddhist monasteries. See architectural wonders, rich traditions, and serene landscapes in this guide.
 Sleeping under the stars and riding camels in Rajasthan
A desert safari in Jaisalmer is definitely one of the highlights during a visit to India. Spending a night in the desert is a great adventurous bucket list experience.
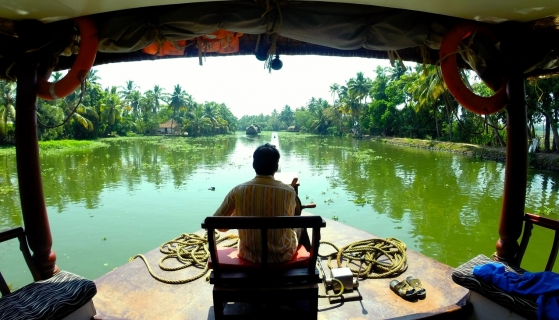 Avoid mass tourism on an eco boat in the backwaters of Kerala
We can tell you now how you can avoid being surrounded by tourists and at the same time minimize your impact on the environment.