Average monthly wind speed in Beringen
The mean monthly wind speed over the year in Beringen (), Belgium.
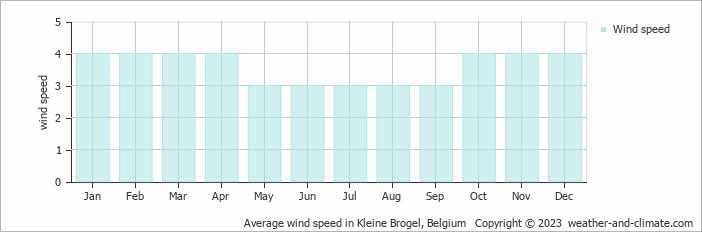
Throughout the year, wind speeds in Beringen average from 3 m/s (6 knots) and increase to 4 m/s (8 knots).
With an average wind speed of 3 m/s (6 knots) in May, June, July, August and September, it experiences a fair and typical breeze. However, conditions can vary between days, and stronger winds may occasionally occur. On a day with 3 m/s (6 knots), leaves and small twigs are constantly in motion, and a flag would be clearly waving. This translates to roughly 11 km/h or 6.7 mph. Most days are suitable for spending time outdoors.
Wind speeds average 4 m/s (8 knots) during January, February, March, April, October, November and December; these fall in the windiest period. This means most days are noticeably windy with small branches moving constantly. Dust gets lifted and papers blow around. The measurement represents 14.4 km/h or 8.9 mph. There may still be stronger gusts or calmer moments, but breezy conditions are typical.
For more detailed information about Beringen’s weather, including monthly rainfall, sunshine hours, and humidity levels, visit our Beringen climate page.


