Valletta Weather & Climate: Best Time to Visit
Average temperatures, rainfall, sunshine and the best time to visit Valletta.
Climate overview of Valletta
Valletta Weather by Month
Pick a month to see the average temperature, rainfall and sunshine in Valletta — and find the best time to visit.
Monthly Temperature in Valletta
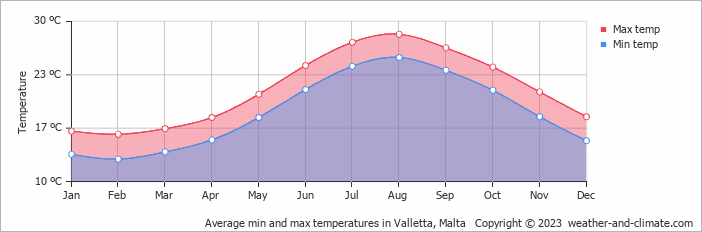
Depending on the time of the year, temperatures range from comfortable to moderate in Valletta. Average daytime temperatures reach a comfortable 28°C (82°F) in August. In February, the coolest month of the year, temperatures drop to a moderate 16°C (61°F).
At night, temperatures range from around 26°C (79°F) in August to 13°C (55°F) in February.
Check out our detailed temperature page for more information.
Temperature ranges by month
Rainfall in Valletta
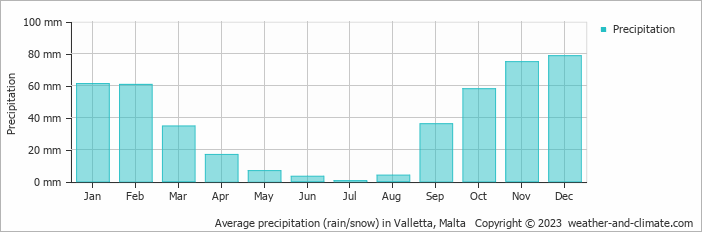
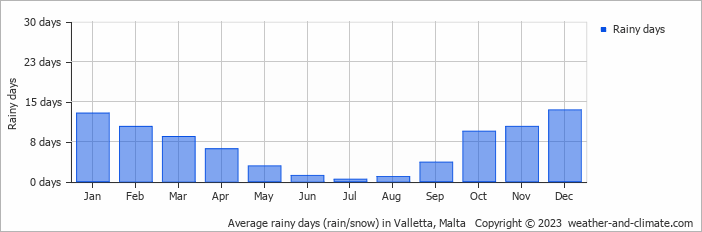
With annual rainfall averaging 435 mm (17 in), Valletta maintains relatively low precipitation levels throughout the seasons. Valletta can be quite wet during December, receiving approximately 79 mm (3.1 in) of precipitation over 13 rainy days.
In contrast, during the driest month (July), you will experience much drier conditions, with 0.5 mm (0.02 in) of precipitation spread across 0 rainy days days. For more details, please visit our Valletta Precipitation page.
The mean monthly precipitation over the year, including rain, hail, and snow
The average number of days each month with precipitation
Sunshine Hours in Valletta
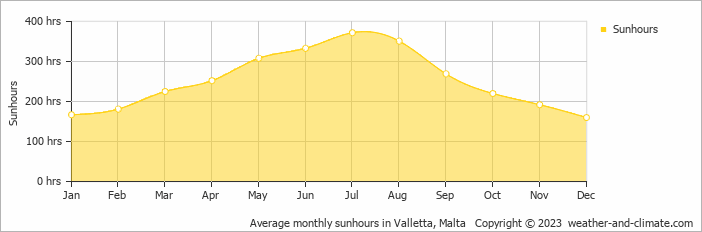
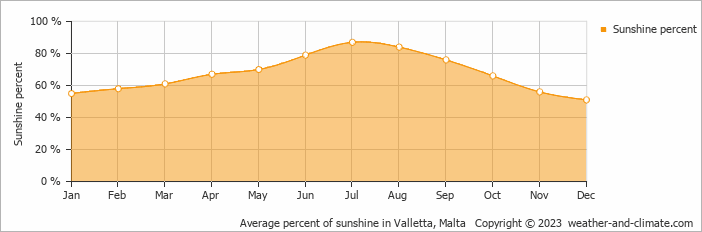
Valletta can be enjoyed more throughout the sunniest month of July under a blue sky, with approximately 12.4 hours of sunshine daily. In contrast, the city experiences much darker days in December, with only 5.3 hours of sunlight per day.
Visit our detailed sunshine hours page for more information.
Monthly hours of sunshine
Daily hours of sunshine
Daily percentage of sunshine
Water Temperature in Valletta
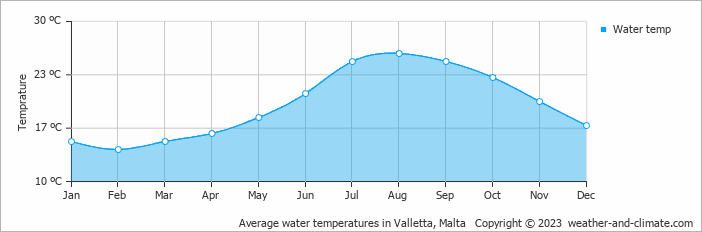
The mean water temperature over the year ranges from 14°C (57°F) in February to 26°C (79°F) in August.
Water temperature over the year
Humidity in Valletta by Month
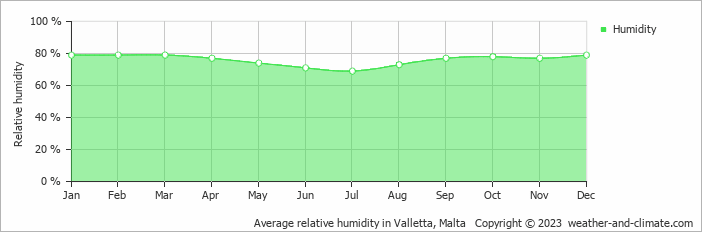
The relative humidity is high throughout the year in Valletta.
The city experiences its highest humidity in January, reaching 79%. In July, the humidity drops to its lowest level at 69%. What does this mean? Read our detailed page on humidity levels for further details.
Relative humidity over the year
Wind Speed in Valletta
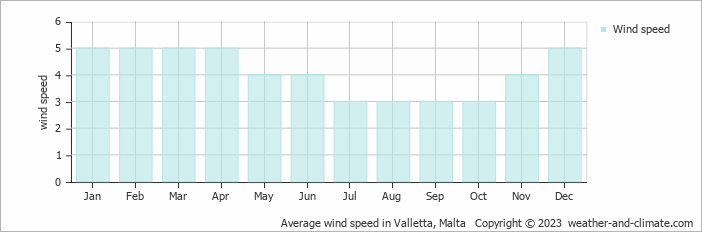
The average wind speed over the year ranges from 3 m/s (6 knots) to 5 m/s (10 knots). It is lower in July, August, September and October and higher in January, February, March, April and December. What does this mean?
The mean monthly wind speed over the year (meters per second)
Best Time to Visit Valletta
Rainfall during this time ranges from 3 mm (0.1 in) in June to 75 mm (3 in) in November. This means you can expect a mix of sunny days and occasional showers. Ready to plan your travels but need destination ideas? Our smart tool recommends places based on the climate conditions you prefer. Start planning with our destination weather tool.
Frequently asked questions about the climate in Valletta
What is the best time to visit Valletta?
April, May, June, July, August, September, October and November typically offer the most optimal weather in Valletta. In contrast, January, February and March tend to have less optimal conditions. Valletta has a distinct dry season from March to September.
What temperatures can I expect in Valletta?
Daytime highs range from 16°C (61°F) in February to 28°C (82°F) in August. Nighttime lows range from 13°C (55°F) to 26°C (79°F). Temperatures vary considerably through the year.
How much rain does Valletta get?
Annual rainfall is around 435 mm (17 in). December is the wettest month with 79 mm (3.1 in), while July is the driest with 0.5 mm (0.02 in).
How sunny is Valletta?
Valletta receives around 3,030 hours of sunshine per year. July is the sunniest month with 372 hours, while December is the cloudiest with just 160 hours. Overall, Valletta enjoys abundant sunshine.
Valletta 3-Day Forecast
Valletta 3-Day Forecast
Valletta on the map
Valletta is highlighted — select any city to see its climate.
Popular this month
Where to go in June — average daytime high across popular destinations.
Bucket list
Need travel inspiration? Check out our bucket list articles and be inspired.
 Gozo, the best kept secret of the Mediterranean
Gozo is much quieter and smaller than Malta and therefore more authentic. Many Maltese use Gozo as their holiday island.
Discover the unique charm of Malta
This small island nation in the Mediterranean Sea has something for everyone, from endless festivals and celebrations to charming villages and stunning coastal views.