Xinglong Weather and Climate: A Comprehensive Guide
Xinglong experiences great temperature shifts.
The city's weather can transition from warm days
to very cold weather.
It receives a moderate amount of precipitation.
Let’s explore the climate details in depth to provide you with a complete overview.
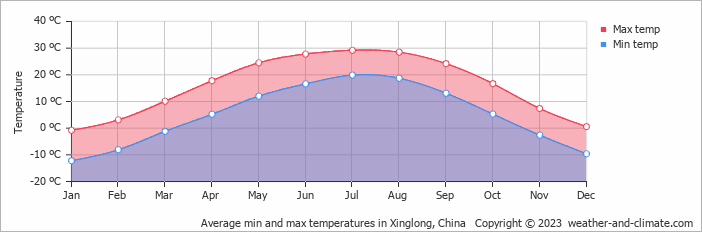
Average maximum day and minimum night temperature
The climate in Xinglong is known for significant temperature differences throughout the year, making the weather dynamic. On average, daytime temperatures range from a comfortable 29°C in July to a very cold -1°C in January.
Nighttime temperatures can drop, with average lows reaching -12°C in January.Check out our detailed temperature page for more information.
Temperature ranges by month
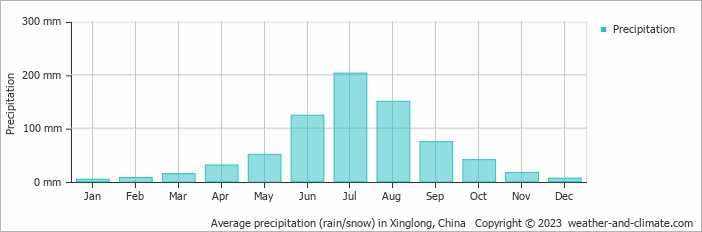
Precipitation and rainy days
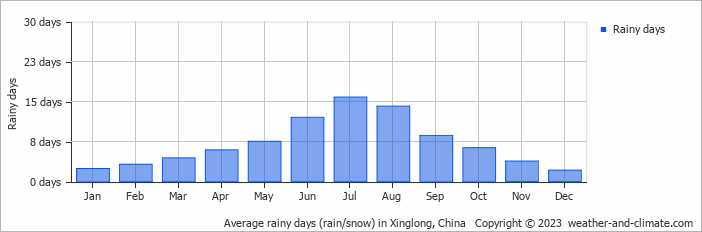
Generally, Xinglong receives mid-range precipitation levels, with 721 mm annually. The seasons in Xinglong, bring significant changes in precipitation. The wettest month, July, receives heavy rainfall, with an average of 203 mm of precipitation. This rainfall is distributed across 16 rainy days.
In contrast, the driest month, January, experiences much less snowfall, totaling 3.9 mm over 2 snowy days. These distinct seasonal differences provide diverse experiences throughout the year. For more details, please visit our Xinglong Precipitation page.The mean monthly precipitation over the year, including rain, hail and snow
The average number of days each month with precipitation
partly cloudy and no rain broken clouds and no rain almost clear and no rainForecast for Xinglong
 2 m/s
2 m/s![]() 3 m/s
3 m/s![]() 4 m/s
4 m/s![]()
Select a Month of Interest
Check the conditions for any month of the year.
The best time of year to visit Xinglong in China
During the months of May and September you are most likely to experience good weather with pleasant average temperatures that fall between 20°C and 26°C.Other facts from our historical weather data:
Most rainfall (rainy season) is seen in July and August.
Yes, the months of January, February, March, November and December are very dry.
July has an average maximum temperature of 29°C and is the warmest month of the year.
The coldest month is January with an average maximum temperature of -1°C.
July tops the wettest month list with 203 mm of rainfall.
January is the driest month with 4 mm of precipitation.
No idea where to travel to this year? We have a tool that recommends destinations based on your ideal conditions. Find out where to go with our weather planner.


