Willemstad Weather & Climate: Best Time to Visit
Average temperatures, rainfall, sunshine and the best time to visit Willemstad.
Climate overview of Willemstad
The climate in Willemstad, Curaçao, is remarkably consistent, with temperatures year-round averaging 29°C (84°F). The warmest month is September at 30°C (86°F), and the coolest is February at 28°C (82°F).
Willemstad sees a moderate amount of rainfall, totalling around 861 mm (34 in) per year. It experiences a distinct dry season from February to March, creating some seasonal variation. Sunshine peaks in August, when the city sees around 10.1 hours of sunshine per day.
Willemstad Weather by Month
Pick a month to see the average temperature, rainfall and sunshine in Willemstad — and find the best time to visit.
Monthly Temperature in Willemstad
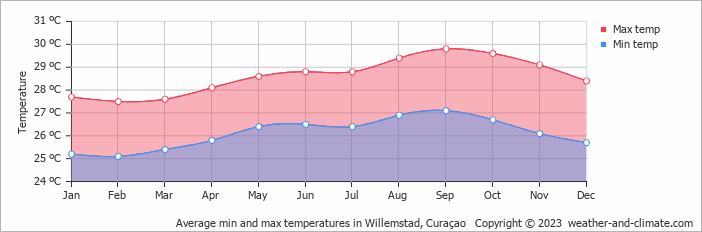
In Willemstad temperatures are generally consistent throughout the year. Average maximum daytime temperatures range from a comfortable 30°C (86°F) in September, the warmest time of the year, to a comfortable 28°C (82°F) during cooler months like February.
At night, you can expect temperatures ranging from 27°C (81°F) in September to around 25°C (77°F) during February.
Check out our detailed temperature page for more information.
Temperature ranges by month
Rainfall in Willemstad
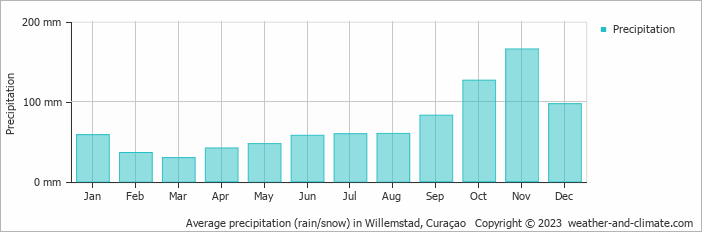
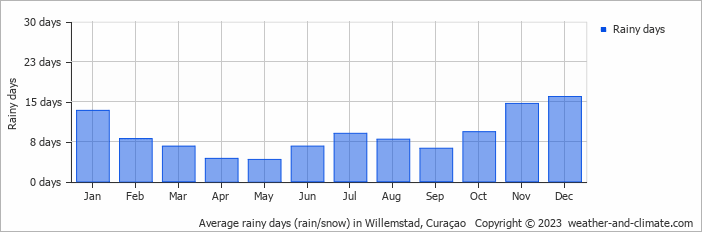
On average, Willemstad receives a reasonable amount of rainfall, with an annual precipitation of 861 mm (34 in). Significant seasonal changes in precipitation occur throughout the year. In the wettest month, November it receives heavy rainfall, averaging 166 mm (6.5 in) of precipitation, recorded across 15 rainy days. In contrast, the driest month March brings less rainfall, with 30 mm (1.2 in) over 7 rainy days. For more details, please visit our Willemstad Precipitation page.
The mean monthly precipitation over the year, including rain, hail, and snow
The average number of days each month with precipitation
Sunshine Hours in Willemstad
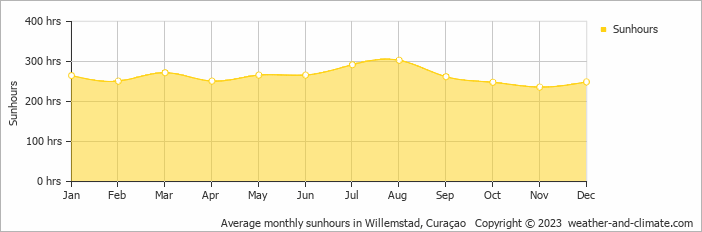
While the amount of sunshine in Willemstad varies throughout the year, all seasons offer their own charm. Enjoy up to 10.1 hours of daily sun in August, and experience slightly darker atmosphere in November, with about 7.9 hours of daily sunlight.
Visit our detailed sunshine hours page for more information.
Monthly hours of sunshine
Daily hours of sunshine
Daily percentage of sunshine
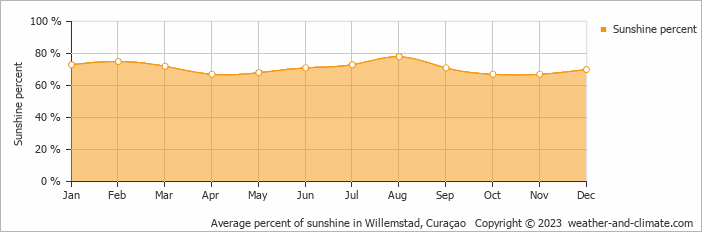
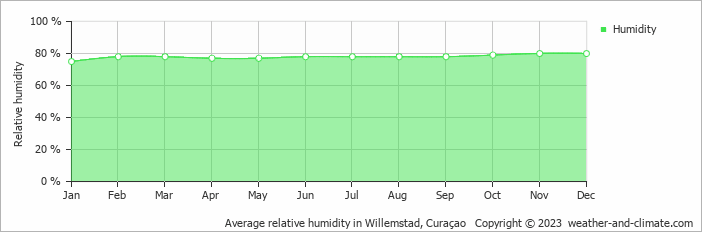
Humidity in Willemstad by Month
The relative humidity is high throughout the year in Willemstad.
The city experiences its highest humidity in November, reaching 80%. In January, the humidity drops to its lowest level at 75%. What does this mean? Read our detailed page on humidity levels for further details.
Relative humidity over the year
Best Time to Visit Willemstad
To make the most of your visit, consider exploring early in the morning or during the pleasant late afternoon hours when the temperature is most comfortable.
Be aware that November has significant precipitation. Need help choosing your next travel destination? We offer a specialized tool that matches you with locations based on your weather preferences. Explore destinations that suit your climate preferences.
Frequently asked questions about the climate in Willemstad
What is the best time to visit Willemstad?
January, February, March, April, May, June, July, August and December typically offer the most optimal weather in Willemstad. In contrast, October tends to have less optimal conditions. Willemstad has a distinct dry season from February to March.
What temperatures can I expect in Willemstad?
Daytime highs range from 28°C (82°F) in February to 30°C (86°F) in September. Nighttime lows range from 25°C (77°F) to 27°C (81°F). Temperatures stay relatively stable year-round.
How much rain does Willemstad get?
Annual rainfall is around 861 mm (34 in). November is the wettest month with 166 mm (6.5 in), while March is the driest with 30 mm (1.2 in).
How sunny is Willemstad?
Willemstad receives around 3,161 hours of sunshine per year. August is the sunniest month with 303 hours, while November is the cloudiest with just 236 hours. Overall, Willemstad enjoys abundant sunshine.
Willemstad 3-Day Forecast
Willemstad 3-Day Forecast
Willemstad on the map
Willemstad is highlighted — select any city to see its climate.
Popular this month
Where to go in June — average daytime high across popular destinations.
Bucket list
Need travel inspiration? Check out our bucket list articles and be inspired.