Villeta Weather and Climate: A Comprehensive Guide
Villeta has relatively stable weather with warm temperatures.
It is also known for its large amounts of rainfall.
Let's now guide you through the climate details for a complete overview.
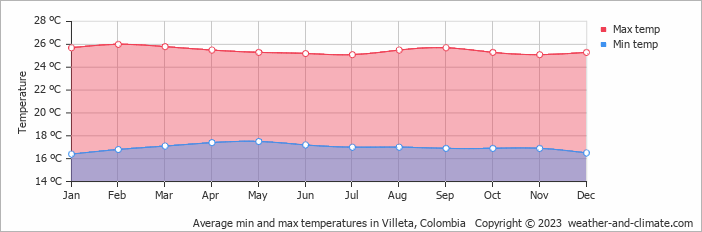
Average maximum day and minimum night temperature
The climate in Villeta remains fairly constant, offering comfortable temperatures throughout the year. Typically, average maximum daytime temperatures range from a comfortable 26°C in February to a comfortable 25°C in the coolest month, January.
Nights are cooler, with lows often dropping to around 16°C during the colder months. Check out our detailed temperature page for more information.Temperature ranges by month
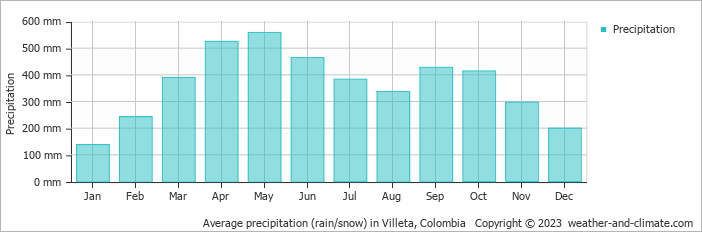
Precipitation and rainy days
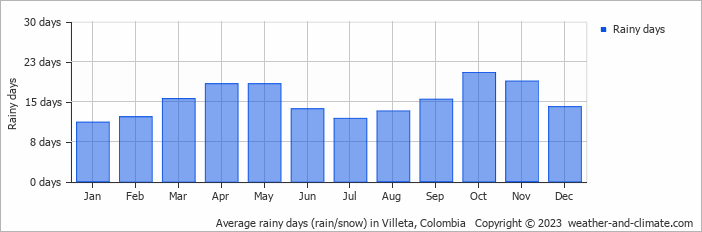
Villeta is known for its substantial rainfall, with annual precipitation reaching 4374 mm. The climate in Villeta shows significant variation throughout the year. Expect heavy rainfall in May, with an average of 558 mm of precipitation over 18 rainy days. In contrast, January offers drier and sunnier days, with around 138 mm of rainfall over 11 rainy days. For more details, please visit our Villeta Precipitation page.The mean monthly precipitation over the year, including rain, hail and snow
The average number of days each month with precipitation
Sunshine over the year
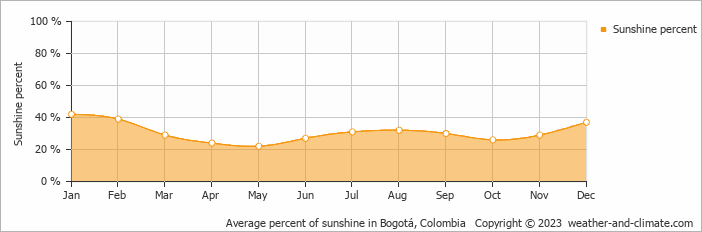
For those who appreciate different seasons, Villeta serves as an ideal destination. Expect longer, more sun-filled days in January with an average of 5.2 hours of sunshine daily, and embrace the darker days in May, offering only 2.8 hours of daily sunlight. Visit our detailed sunshine hours page for more information.Monthly hours of sunshine
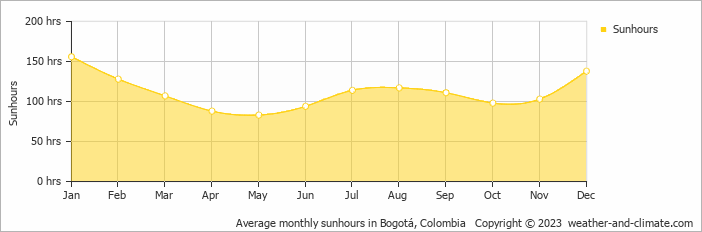
Daily hours of sunshine
Daily percentage of sunshine
Average humidity
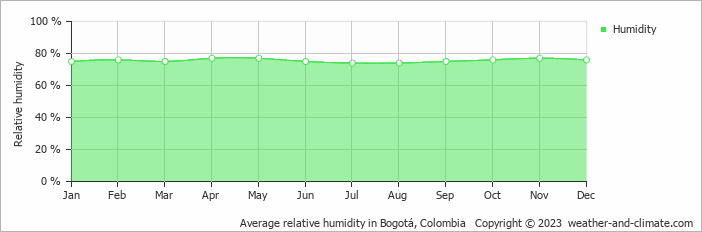
The relative humidity is high throughout the year in Villeta.
The city experiences its highest humidity in April, reaching 77%. In July, the humidity drops to its lowest level at 74%. What does this mean? Read our detailed page on humidity levels for further details.
Relative humidity over the year
broken clouds and chance of rain broken clouds and chance of rain broken clouds and thunderForecast for Villeta
 1 m/s
1 m/s![]() 2 m/s
2 m/s![]() 2 m/s
2 m/s![]()
Select a Month of Interest
Check the conditions for any month of the year.
The best time of year to visit Villeta in Colombia
The average rainfall figures in Villeta are quite high. Throughout the year, you have a chance of prolonged precipitation. So no matter what time of year you go, you will always have to deal with a high number of rainy days. This makes it more challenging to point out the best time of year to visit. If we needed to pick one month we would choose January which is the sunniest month of the year.Other facts from our historical weather data:
February has an average maximum temperature of 26°C and is the warmest month of the year.
The coldest month is January with an average maximum temperature of 25°C.
May tops the wettest month list with 558 mm of rainfall.
January is the driest month with 138 mm of precipitation.
January is the sunniest month with an average of 156 hours of sunshine.
No idea where to travel to this year? We have a tool that recommends destinations based on your ideal conditions. Find out where to go with our weather planner.


