Valgiano Weather & Climate: Best Time to Visit
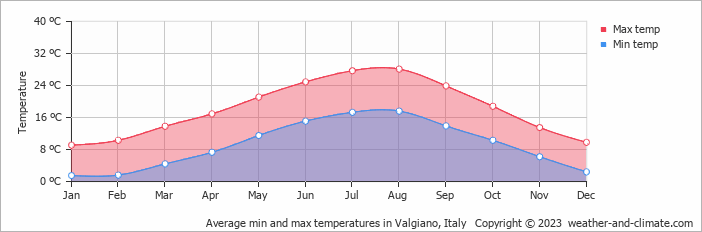
Temperatures in Valgiano, Tuscany, Italy, vary greatly throughout the year. August is the hottest month at 28°C (82°F), while January is the coldest at 9°C (48°F).
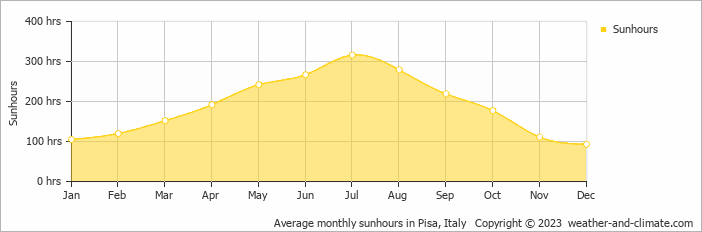
The city receives considerable rain/snowfall, with around 1256 mm (49 in) annually. November is the wettest month. July is the sunniest month, averaging 10.5 hours of sunshine per day.
Monthly Temperature in Valgiano
The climate in Valgiano is known for significant temperature differences throughout the year, making the weather dynamic. Typically, average maximum daytime temperatures range from a comfortable 28°C (82°F) in August to a chilly 9°C (48°F) in the coolest month, January.
Nights vary from 18°C (64°F) in August to around 2°C (36°F) during the colder months.Check out our detailed temperature page for more information.
Temperature ranges by month
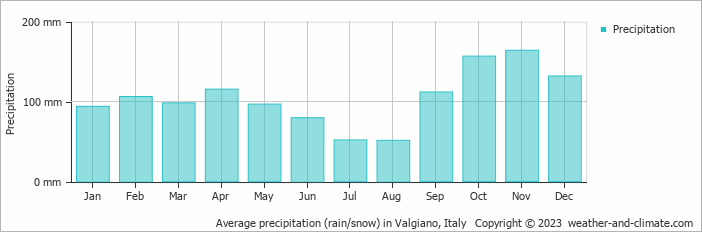
Rainfall in Valgiano
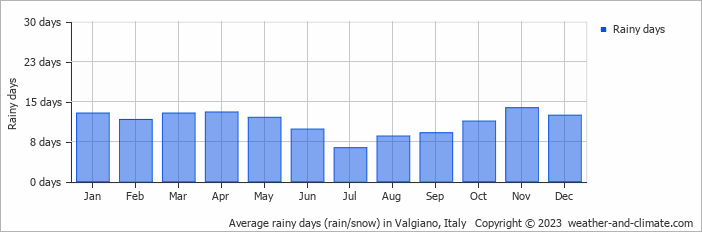
Valgiano has a notably wet climate with abundant precipitation, recording 1256 mm (49 in) of rain/snowfall per year. The climate in Valgiano shows significant variation throughout the year. Expect heavy rainfall in November, the wettest month, with an average of 164 mm (6.5 in) of precipitation over 14 rainy days.
In contrast, the driest month August offers drier and sunnier days, with around 51 mm (2 in) of rainfall over 9 rainy days. For more details, please visit our Valgiano Precipitation page.The mean monthly precipitation over the year, including rain, hail, and snow
The average number of days each month with precipitation
Sunshine Hours in Valgiano
For those who appreciate different seasons, Valgiano serves as an ideal destination. Expect longer, more sun-filled days in July with an average of 10.5 hours of sunshine daily, and embrace the darker days in December, offering only 3.1 hours of daily sunlight.
Visit our detailed sunshine hours page for more information.
Monthly hours of sunshine
Daily hours of sunshine
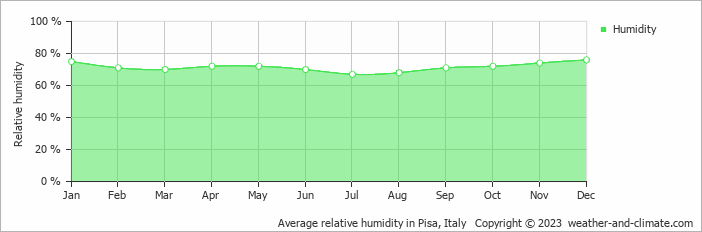
Humidity in Valgiano by Month
The relative humidity is high throughout the year in Valgiano.
The city experiences its highest humidity in December, reaching 76%. In July, the humidity drops to its lowest level at 67%. What does this mean? Read our detailed page on humidity levels for further details.
Relative humidity over the year
Valgiano 3-Day Forecast
Check the conditions for any month of the year.
Best Time to Visit Valgiano
Valgiano's weather is most enjoyable during May, June, July, August and September, with comfortable temperatures from 21°C (70°F) to 28°C (83°F). The moderate conditions ensure pleasant weather for exploring the area. Expect varied weather during this period with rainfall between 51 mm (2 in) and 112 mm (4.4 in), providing a good balance of sunny and rainy days.The wettest months are November, when precipitation is at its highest. Wondering where to travel based on your weather preferences? Our recommendation tool helps you find destinations with your ideal climate conditions. Use our weather planner to find your perfect destination.


