

















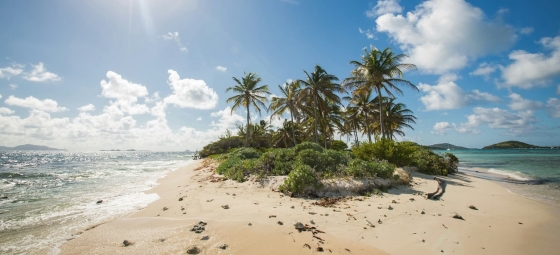
 10 Hidden gems in Asia you need to visit
Explore 10 hidden gems in Asia offering authentic experiences, from pristine beaches and remote islands to cultural treks and peaceful mountain villages.
Average temperatures, rainfall, sunshine and the best time to visit Tumbangrungan.
 –
–
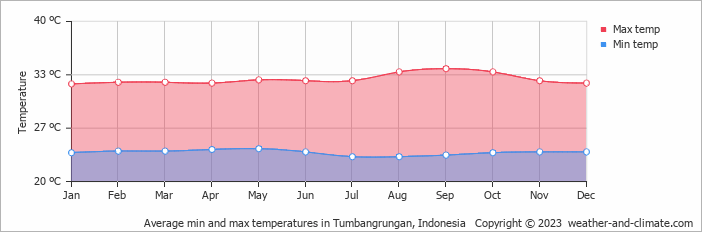
Tumbangrungan, Central Kalimantan, Indonesia, has a stable climate with little temperature variation across the year. Average daytime temperatures hover around 33°C (91°F), peaking in September at 34°C (93°F) and dipping in January to 32°C (90°F).
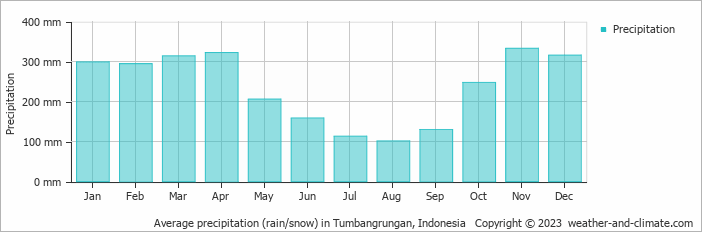
The city receives considerable rainfall, with around 2831 mm (111 in) annually. November is the wettest month. It has a distinct rainy season from October to May.
Pick a month to see the average temperature, rainfall and sunshine in Tumbangrungan - and find the best time to visit.
With minimal seasonal shifts, Tumbangrungan experiences a constant climate year-round. Typically, average maximum daytime temperatures range from a very warm 34°C (93°F) in September to a very warm 32°C (90°F) in the coolest month, January.
Nights vary from 24°C (75°F) in September to around 23°C (73°F) during the colder months.
Check out our detailed temperature page for more information.
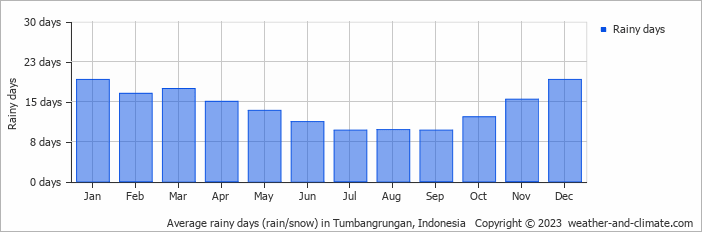
Tumbangrungan has a notably wet climate with abundant precipitation, recording 2831 mm (111 in) of rainfall per year. The climate in Tumbangrungan shows significant variation throughout the year. Expect heavy rainfall in November, the wettest month, with an average of 333 mm (13 in) of precipitation over 15 rainy days.
In contrast, the driest month August offers drier and sunnier days, with around 101 mm (4 in) of rainfall over 10 rainy days. For more details, please visit our Tumbangrungan Precipitation page.
Monthly ratings reflect general weather comfort, based on daytime temperature and rainfall. Swimming and winter conditions are highlighted separately where relevant.
Tumbangrungan has a distinct rainy season from October to May.
Daytime highs range from 32°C (90°F) in January to 34°C (93°F) in September. Nighttime lows range from 23°C (73°F) to 24°C (75°F). Temperatures stay relatively stable year-round.
Annual rainfall is around 2831 mm (111 in). November is the wettest month with 333 mm (13 in), while August is the driest with 101 mm (4 in).
Tumbangrungan is highlighted - select any city to see its climate.
Where to go in September - average daytime high across popular destinations.
Need travel inspiration? Check out our bucket list articles and be inspired.
10 Hidden gems in Asia you need to visit
Explore 10 hidden gems in Asia offering authentic experiences, from pristine beaches and remote islands to cultural treks and peaceful mountain villages.
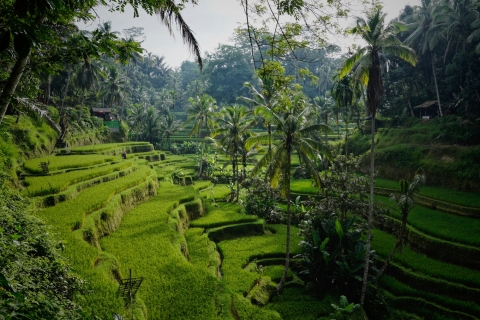 The ultimate guide to Ubud – everything you need to know to escape the crowds
There is a way to experience Ubud in a fantastic less crowded way and this article will be your guide how to do that. Find the best places to stay, where to eat and much more.
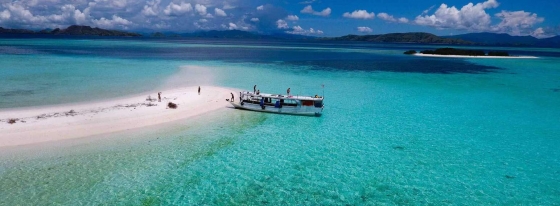 Top 5 hidden gem islands in Indonesia
Discover Indonesia's secret islands: pristine beaches, rich history, and vibrant culture await beyond Bali and Java. Dive into untouched paradise.
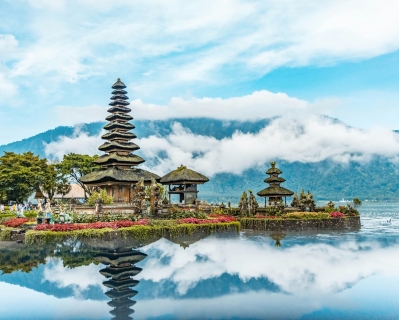 Indonesia in July: Bali, Java or Lombok?
Compare July weather in Bali, Lombok, the Gili Islands, Yogyakarta and Jakarta to find Indonesia's driest, sunniest and best beach conditions.