Sungai Kolok Weather & Climate: Best Time to Visit
Average temperatures, rainfall, sunshine and the best time to visit Sungai Kolok.
Climate overview of Sungai Kolok
The climate in Sungai Kolok, Narathiwas Province, Thailand, is remarkably consistent, with temperatures year-round averaging 32°C (90°F). The warmest month is April at 34°C (93°F), and the coolest is December at 30°C (86°F).
The city receives considerable rainfall, with around 2751 mm (108 in) annually. December is the wettest month. April is the sunniest month, averaging 7.2 hours of sunshine per day.
Sungai Kolok Weather by Month
Pick a month to see the average temperature, rainfall and sunshine in Sungai Kolok - and find the best time to visit.
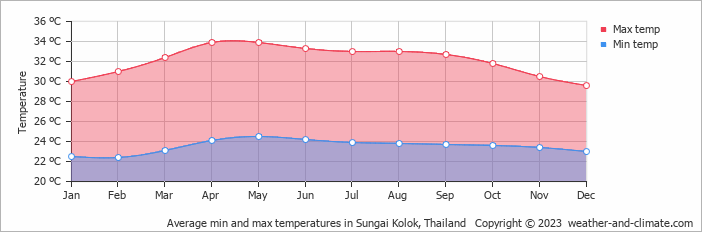
Monthly Temperature in Sungai Kolok
In Sungai Kolok temperatures are generally consistent throughout the year. Typically, average maximum daytime temperatures range from a very warm 34°C (93°F) in April to a comfortable 30°C (86°F) in the coolest month, December.
Nights vary from 25°C (77°F) in April to around 22°C (72°F) during the colder months.
Check out our detailed temperature page for more information.
Temperature ranges by month
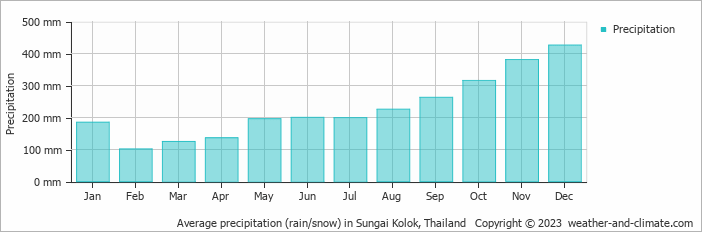
Rainfall in Sungai Kolok
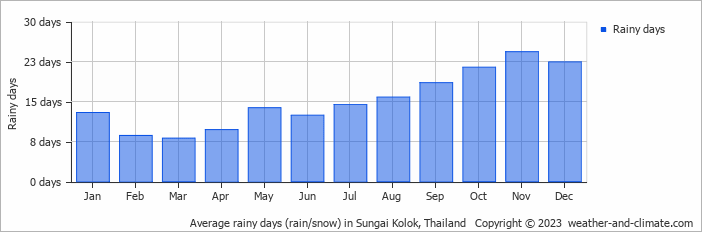
Sungai Kolok experiences significant rainfall throughout the year, averaging 2751 mm (108 in) of precipitation annually. The climate in Sungai Kolok shows significant variation throughout the year. Expect heavy rainfall in December, the wettest month, with an average of 426 mm (17 in) of precipitation over 22 rainy days.
In contrast, the driest month February offers drier and sunnier days, with around 101 mm (4 in) of rainfall over 9 rainy days. For more details, please visit our Sungai Kolok Precipitation page.
The mean monthly precipitation over the year, including rain, hail, and snow
The average number of days each month with precipitation
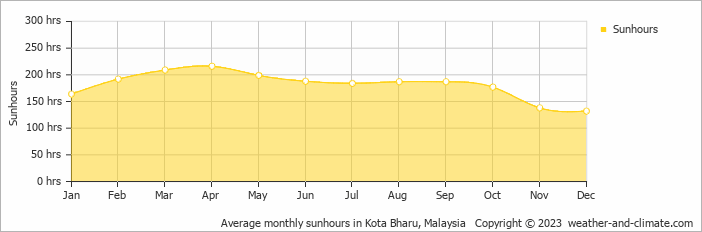
Sunshine Hours in Sungai Kolok
Sungai Kolok offers a pleasant mix of sunny and slightly overcast days. The difference in sunshine hours between April (7.2 hours daily) and December (4.4 hours daily) provides a bit of variety for visitors and residents.
Visit our detailed sunshine hours page for more information.
Monthly hours of sunshine
Daily hours of sunshine
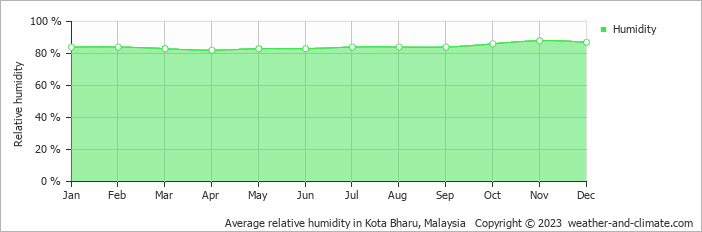
Humidity in Sungai Kolok by Month
The city experiences its highest humidity in November, reaching 88%. In April, the humidity drops to its lowest level at 82%. What does this mean? Read our detailed page on humidity levels for further details.
Relative humidity over the year
Best Time to Visit Sungai Kolok
Monthly ratings reflect general weather comfort, based on daytime temperature and rainfall. Swimming and winter conditions are highlighted separately where relevant.
- Best overall: February and March
- Warmest weather: March, April, May, June, July, August and September
- Most sunshine: March and April
- Fewest rainy days: February, March and April
- Wettest months: September, October, November and December, when rainfall is highest.
Frequently asked questions about the climate in Sungai Kolok
What is the best time to visit Sungai Kolok?
February and March typically offer the most optimal weather in Sungai Kolok. In contrast, January, April, May, June, July, August, September, October, November and December tend to have less optimal conditions.
What temperatures can I expect in Sungai Kolok?
Daytime highs range from 30°C (86°F) in December to 34°C (93°F) in April. Nighttime lows range from 22°C (72°F) to 25°C (77°F). Temperatures stay relatively stable year-round.
How much rain does Sungai Kolok get?
Annual rainfall is around 2751 mm (108 in). December is the wettest month with 426 mm (17 in), while February is the driest with 101 mm (4 in).
How sunny is Sungai Kolok?
Sungai Kolok receives around 2,173 hours of sunshine per year. April is the sunniest month with 216 hours, while December is the cloudiest with just 132 hours. Overall, Sungai Kolok enjoys abundant sunshine.
Sungai Kolok 3-Day Forecast
Sungai Kolok 3-Day Forecast
Sungai Kolok on the map
Sungai Kolok is highlighted - select any city to see its climate.
Popular this month
Where to go in July - average daytime high across popular destinations.
Bucket list
Need travel inspiration? Check out our bucket list articles and be inspired.
 Discover Kok Kood: a hidden gem in Thailand
Discover the hidden gem of Thailand - Koh Kood! Explore stunning beaches, waterfalls and eco-friendly resorts while enjoying a peaceful atmosphere away from the crowds.
Discover Thailand: An Ultimate Guide for Yogis
Explore Thailand's best for yogis: serene retreats, spiritual growth, and adventure. Dive into yoga, meditation, and nature's tranquility for an unforgettable journey.
Trekking in Northern Thailand
One of the most beautiful attractions in Thailand is trekking along mountain villages north of Chiang Mai. The best time to trek is November until February.
Elephant Haven in Thailand: Kindred Spirit Sanctuary
Explore the Kindred Spirit Elephant Sanctuary in Thailand. Experience hiking, observe elephants in nature, and see the positive impact on the community.