Río San Juan Weather & Climate: Best Time to Visit
Average temperatures, rainfall, sunshine and the best time to visit Río San Juan.
Climate overview of Río San Juan
The climate in Río San Juan, Puerto Plata Province, Dominican Republic, is remarkably consistent, with temperatures year-round averaging 29°C (84°F). The warmest month is September at 31°C (88°F), and the coolest is February at 27°C (81°F).
The city has a wet climate, receiving around 1337 mm (53 in) of rainfall per year. November is the wettest month.
Río San Juan Weather by Month
Pick a month to see the average temperature, rainfall and sunshine in Río San Juan — and find the best time to visit.
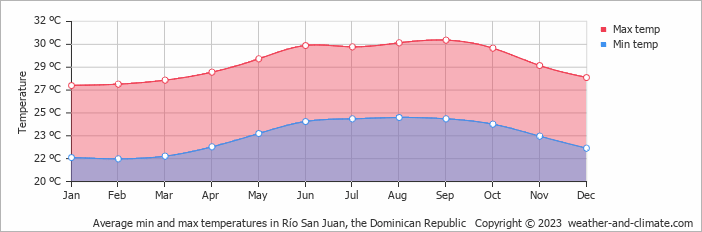
Monthly Temperature in Río San Juan
In Río San Juan temperatures are generally consistent throughout the year. On average, daytime temperatures range from a very warm 31°C (88°F) in September to a comfortable 27°C (81°F) in February.
Nighttime temperatures range from 25°C (77°F) in September to 22°C (72°F) in February.
Check out our detailed temperature page for more information.
Temperature ranges by month
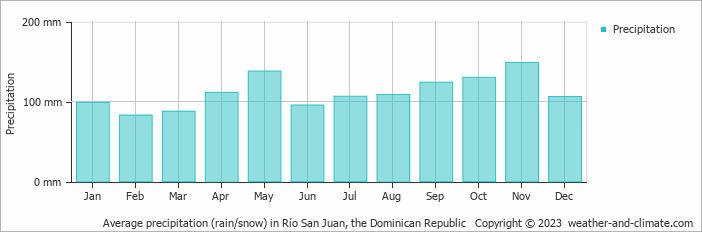
Rainfall in Río San Juan
Río San Juan experiences significant rainfall throughout the year, averaging 1337 mm (53 in) of precipitation annually. The amount of precipitation varies moderately throughout the year. The wettest month, November, sees around 149 mm (5.9 in) of rainfall, perfect for those who enjoy a bit of rain now and then. The driest month, February, still receives a respectable 83 mm (3.3 in) of rainfall. For more details, please visit our Río San Juan Precipitation page.
The mean monthly precipitation over the year, including rain, hail, and snow
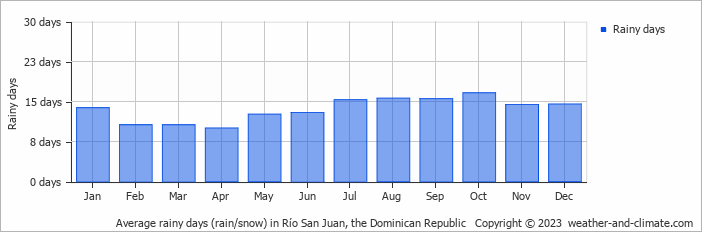
The average number of days each month with precipitation
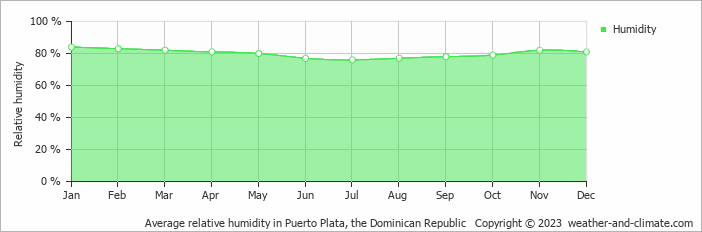
Humidity in Río San Juan by Month
The city experiences its highest humidity in January, reaching 84%. In July, the humidity drops to its lowest level at 76%. What does this mean? Read our detailed page on humidity levels for further details.
Relative humidity over the year
Best Time to Visit Río San Juan
To make the most of your visit, consider exploring early in the morning or during the pleasant late afternoon hours when the temperature is most comfortable. Looking for inspiration on where to travel this year? We have a tool that recommends destinations based on your ideal conditions. Find out where to go with our weather planner.
Frequently asked questions about the climate in Río San Juan
What is the best time to visit Río San Juan?
January, February and March typically offer the most optimal weather in Río San Juan. In contrast, July, August, September and October tend to have less optimal conditions.
What temperatures can I expect in Río San Juan?
Daytime highs range from 27°C (81°F) in February to 31°C (88°F) in September. Nighttime lows range from 22°C (72°F) to 25°C (77°F). Temperatures stay relatively stable year-round.
How much rain does Río San Juan get?
Annual rainfall is around 1337 mm (53 in). November is the wettest month with 149 mm (5.9 in), while February is the driest with 83 mm (3.3 in).
Río San Juan 3-Day Forecast
Río San Juan 3-Day Forecast
Río San Juan on the map
Río San Juan is highlighted — select any city to see its climate.
Popular this month
Where to go in July — average daytime high across popular destinations.
Bucket list
Need travel inspiration? Check out our bucket list articles and be inspired.
 5 Tranquil Spots in the Dominican Republic
Explore the hidden gems of the Dominican Republic, from Bahía de Las Águilas to Constanza. Discover tranquil beaches, mountains, and green landscapes.
Windsurf in Cabarete
The best travel time for Cabarete in the Dominican Republic is from January to April, June to October and December. If you like Wind Surfing than you must add the surf paradise Cabarete on your bucket list.