Ranong Weather & Climate: Best Time to Visit
Average temperatures, rainfall, sunshine and the best time to visit Ranong.
Climate overview of Ranong
Ranong, in Thailand's Ranong Province, maintains fairly consistent very warm temperatures throughout the year with minimal variation. The area has a relatively rainy climate with high precipitation levels, especially during the heavy monsoon periods. Ranong is a border town which sits near Myanmar where people come to do visa runs and soak in the natural hot springs. Some visitors also use it as a departure point for boats to Koh Chang and other nearby islands. Let's explore the climate details to provide you with a complete overview on when to visit.
Ranong Weather by Month
Pick a month to see the average temperature, rainfall and sunshine in Ranong — and find the best time to visit.
Monthly Temperature in Ranong
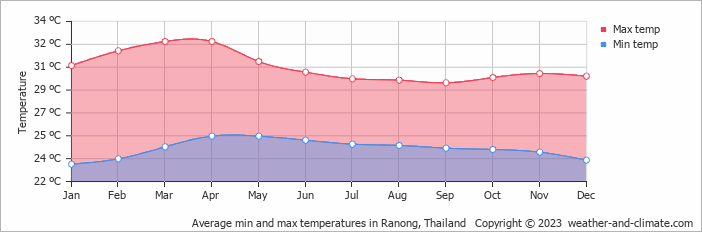
With minimal seasonal shifts, Ranong experiences a constant climate year-round. On average, daytime temperatures range from a very warm 33°C (91°F) in March to a comfortable 29°C (84°F) in January.
Nighttime temperatures range from 25°C (77°F) in March to 23°C (73°F) in January.
Check out our detailed temperature page for more information.
Temperature ranges by month
Rainfall in Ranong
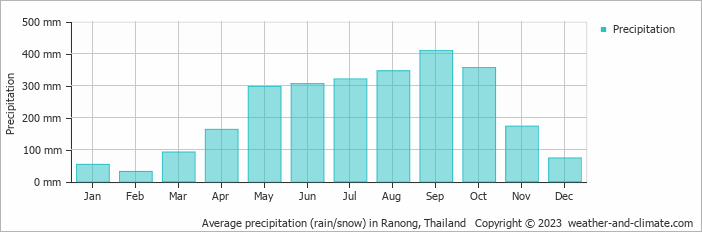
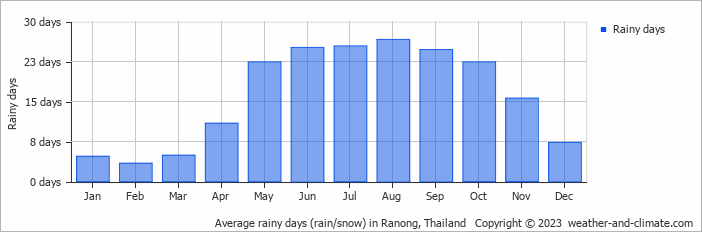
Ranong has a notably wet climate with abundant precipitation, recording 2615 mm (103 in) of rainfall per year. The seasons in Ranong bring significant changes in precipitation. The wettest month, September, receives heavy rainfall, with an average of 409 mm (16 in) of precipitation. This rainfall is distributed across 25 rainy days.
In contrast, the driest month, February, experiences much less rainfall, totaling 31 mm (1.2 in) over 3 rainy days. These distinct seasonal differences provide diverse experiences throughout the year. For more details, please visit our Ranong Precipitation page.
The mean monthly precipitation over the year, including rain, hail, and snow
The average number of days each month with precipitation
Sunshine Hours in Ranong
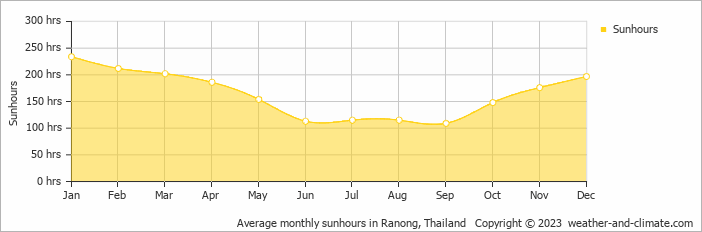
In Ranong, summer days are longer and more sunny, with daily sunshine hours peaking at 7.8 hours in January. As the darker season arrives, the brightness of the sun becomes less. September sees a soft sun for only 3.6 hours per average day.
Visit our detailed sunshine hours page for more information.
Monthly hours of sunshine
Daily hours of sunshine
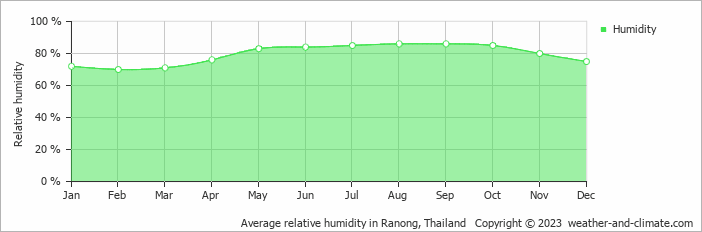
Humidity in Ranong by Month
The relative humidity is high throughout the year in Ranong.
The city experiences its highest humidity in August, reaching 86%. In February, the humidity drops to its lowest level at 70%. What does this mean? Read our detailed page on humidity levels for further details.
Relative humidity over the year
Best Time to Visit Ranong
It's smart to plan your activities during the cooler morning hours or take advantage of the refreshing evenings.
Note that April, May, June, July, August, September, October and November make up the rainy season, with heavier precipitation expected. Need help choosing your next travel destination? We offer a specialized tool that matches you with locations based on your weather preferences. Explore destinations that suit your climate preferences.
Frequently asked questions about the climate in Ranong
What is the best time to visit Ranong?
January, February and December typically offer the most optimal weather in Ranong. In contrast, April, May, June, July, August, September and October tend to have less optimal conditions. Ranong has a distinct rainy season from May to November.
What temperatures can I expect in Ranong?
Daytime highs range from 29°C (84°F) in January to 33°C (91°F) in March. Nighttime lows range from 23°C (73°F) to 25°C (77°F). Temperatures stay relatively stable year-round.
How much rain does Ranong get?
Annual rainfall is around 2615 mm (103 in). September is the wettest month with 409 mm (16 in), while February is the driest with 31 mm (1.2 in).
How sunny is Ranong?
Ranong receives around 1,961 hours of sunshine per year. January is the sunniest month with 234 hours, while September is the cloudiest with just 109 hours.
Ranong 3-Day Forecast
Ranong 3-Day Forecast
Ranong on the map
Ranong is highlighted — select any city to see its climate.
Popular this month
Where to go in July — average daytime high across popular destinations.
Bucket list
Need travel inspiration? Check out our bucket list articles and be inspired.
 Discover Kok Kood: a hidden gem in Thailand
Discover the hidden gem of Thailand - Koh Kood! Explore stunning beaches, waterfalls and eco-friendly resorts while enjoying a peaceful atmosphere away from the crowds.
Discover Thailand: An Ultimate Guide for Yogis
Explore Thailand's best for yogis: serene retreats, spiritual growth, and adventure. Dive into yoga, meditation, and nature's tranquility for an unforgettable journey.
Trekking in Northern Thailand
One of the most beautiful attractions in Thailand is trekking along mountain villages north of Chiang Mai. The best time to trek is November until February.
Elephant Haven in Thailand: Kindred Spirit Sanctuary
Explore the Kindred Spirit Elephant Sanctuary in Thailand. Experience hiking, observe elephants in nature, and see the positive impact on the community.