
















 The Li River: A Journey Through China’s Most Breathtaking Landscape
Explore the Li River, China's breathtaking landscape with majestic mountains, serene waters, and picturesque views. A must-see for every traveler.
Average temperatures, rainfall, sunshine and the best time to visit Quyang.
 –
–
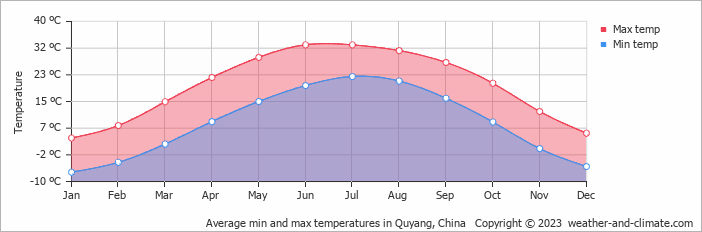
Quyang, China, sees big temperature differences between seasons, with June peaking at 33°C (91°F) and January dropping to 4°C (39°F).
Quyang sees a moderate amount of rain/snowfall, totalling around 580 mm (23 in) per year. It experiences a distinct dry season from October to May, with very warm summers and cold winters, creating some seasonal variation. The most sunshine falls in May, with an average of 8.8 hours of daily sunshine.
Pick a month to see the average temperature, rainfall and sunshine in Quyang - and find the best time to visit.
Visitors to Quyang can expect significant temperature changes throughout the year. Average maximum daytime temperatures range from a very warm 33°C (91°F) in June, the warmest time of the year, to a chilly 4°C (39°F) during cooler months like January.
At night, you can expect temperatures ranging from 23°C (73°F) in June to around -7°C (19°F) during January.
Check out our detailed temperature page for more information.
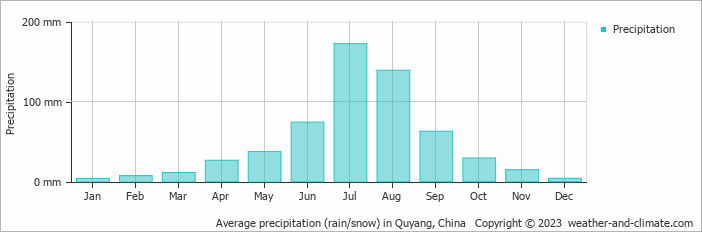
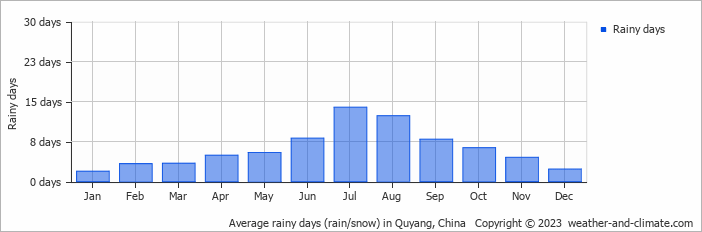
Generally, Quyang experiences moderate precipitation patterns, averaging 580 mm (23 in) yearly. Significant seasonal changes in precipitation occur throughout the year. In the wettest month, July it receives heavy rainfall, averaging 172 mm (6.8 in) of precipitation, recorded across 14 rainy days. In contrast, the driest month January brings less snow/rainfall, with 3.7 mm (0.1 in) over 2 snowy/rainy days. For more details, please visit our Quyang Precipitation page.
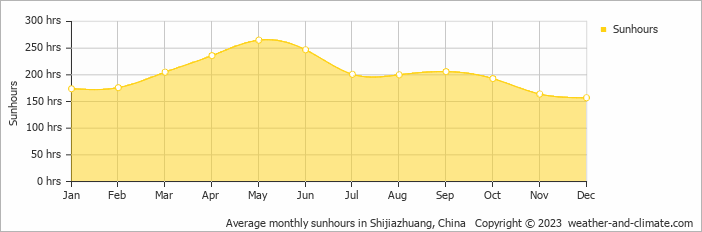
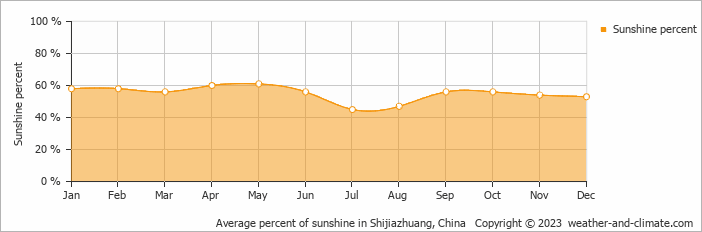
Seasonal changes in sunshine hours are quite dramatic in Quyang. While May receives considerable daily sunshine with up to 8.8 hours, December marks the darkest time of the year, where sunshine is scarce with only 5.2 hours of sunlight per day.
Visit our detailed sunshine hours page for more information.
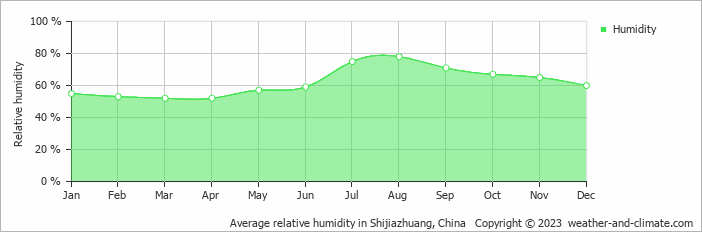
The relative humidity is high throughout the year in Quyang.
The city experiences its highest humidity in August, reaching 78%. In March, the humidity drops to its lowest level at 52%. What does this mean? Read our detailed page on humidity levels for further details.
Monthly ratings reflect general weather comfort, based on daytime temperature and rainfall. Swimming and winter conditions are highlighted separately where relevant.
April, May, September and October typically offer the most optimal weather in Quyang. In contrast, January and July tend to have less optimal conditions. Quyang has a distinct dry season from October to May, with very warm summers and cold winters.
Daytime highs range from 4°C (39°F) in January to 33°C (91°F) in June. Nighttime lows range from -7°C (19°F) to 23°C (73°F). Temperatures vary considerably through the year.
Annual rainfall is around 580 mm (23 in). July is the wettest month with 172 mm (6.8 in), while January is the driest with 3.7 mm (0.1 in).
Quyang receives around 2,424 hours of sunshine per year. May is the sunniest month with 265 hours, while December is the cloudiest with just 157 hours. Overall, Quyang enjoys abundant sunshine.
Quyang is highlighted - select any city to see its climate.
Where to go in October - average daytime high across popular destinations.
Guangzhou 30°C (86°F) Shenzhen29°C (84°F) Hangzhou25°C (77°F) Shanghai24°C (75°F) Chengdu
 22°C (72°F) Xi'an21°C (70°F) Beijing
 21°C (70°F) Qingdao21°C (70°F)
 Need travel inspiration? Check out our bucket list articles and be inspired.
The Li River: A Journey Through China’s Most Breathtaking Landscape
Explore the Li River, China's breathtaking landscape with majestic mountains, serene waters, and picturesque views. A must-see for every traveler.
 Go to China's Zhangjiajie National Park with the highest, the fastest, largest-loaded outdoor elevator in the world
You won't find this unique landscape anywhere else in the world. Thousands of floating mountains overgrown with trees at the top dominate this fairy tale landscape.
 Go to Xinjiang in China
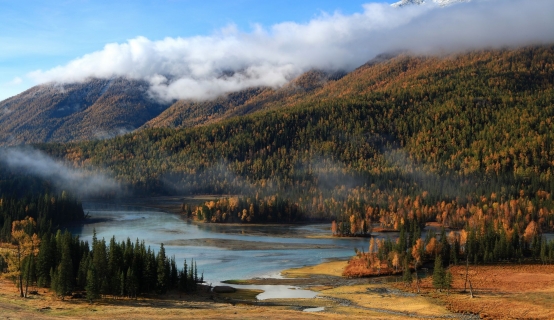
In Xinjiang you get to see a mix of East and Central Asia. An experience that you might want to add to your bucket list. You can travel through the province as if you are following an ancient silk route.
 Mount Kailash
The best time for a Kailash tour/trekking is from mid-May to mid-October when the temperature is most pleasant. It is warm, dry and sunny in that period.