Quillota Weather & Climate: Best Time to Visit
Average temperatures, rainfall, sunshine and the best time to visit Quillota.
Climate overview of Quillota
Quillota, Valparaíso Region, Chile, has a moderate seasonal temperature range, with January reaching 26°C (79°F) and July cooling to 16°C (61°F).
The city has a relatively dry climate, receiving around 352 mm (14 in) of rainfall per year. It does experience a distinct dry season from September to April, with warm summers and mild winters. June is the wettest month and January the driest. The sunniest month is January, with 9.3 hours of sunshine per day on average.
Quillota Weather by Month
Pick a month to see the average temperature, rainfall and sunshine in Quillota - and find the best time to visit.
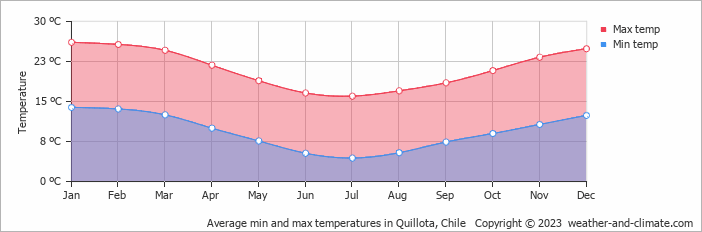
Monthly Temperature in Quillota
The climate in Quillota experiences moderate temperature changes, with mild shifts between seasons. On average, daytime temperatures range from a comfortable 26°C (79°F) in January to a moderate 16°C (61°F) in July.
Nighttime temperatures range from 14°C (57°F) in January to 4°C (39°F) in July.
Check out our detailed temperature page for more information.
Temperature ranges by month
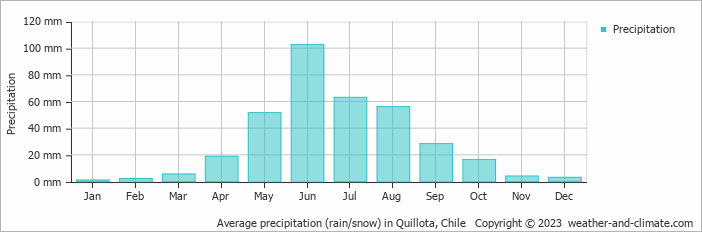
Rainfall in Quillota
Quillota tends toward drier weather patterns, receiving approximately 352 mm (14 in) of rain per year. The seasons in Quillota bring significant changes in precipitation. The wettest month, June, receives high rainfall, with an average of 103 mm (4.1 in) of precipitation. This rainfall is distributed across 3 rainy days.
In contrast, the driest month, January, experiences much less rainfall, totaling 1 mm (0.04 in) over 3 rainy days. These distinct seasonal differences provide diverse experiences throughout the year. For more details, please visit our Quillota Precipitation page.
The mean monthly precipitation over the year, including rain, hail, and snow
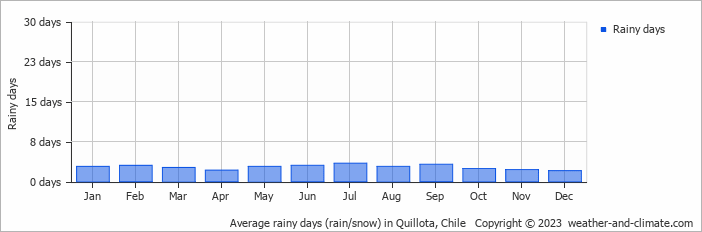
The average number of days each month with precipitation
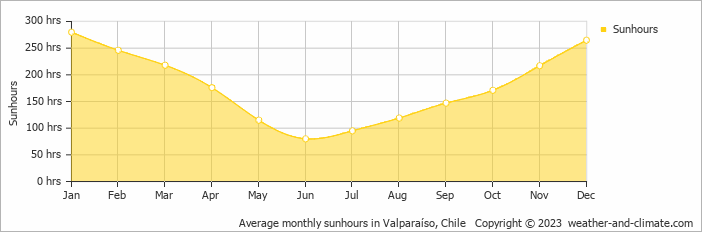
Sunshine Hours in Quillota
In Quillota, summer days are longer and more sunny, with daily sunshine hours peaking at 9.3 hours in January. As the darker season arrives, the brightness of the sun becomes less. June sees a soft sun for only 2.7 hours per average day.
Visit our detailed sunshine hours page for more information.
Monthly hours of sunshine
Daily hours of sunshine
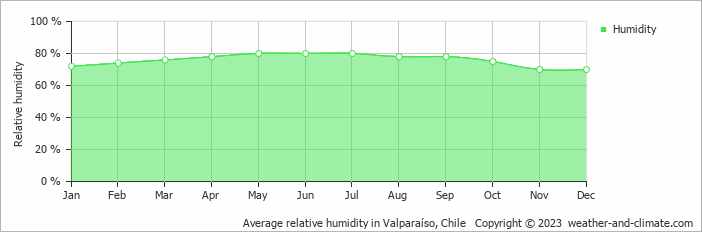
Humidity in Quillota by Month
The relative humidity is high throughout the year in Quillota.
The city experiences its highest humidity in May, reaching 80%. In November, the humidity drops to its lowest level at 70%. What does this mean? Read our detailed page on humidity levels for further details.
Relative humidity over the year
Best Time to Visit Quillota
Monthly ratings reflect general weather comfort, based on daytime temperature and rainfall. Swimming and winter conditions are highlighted separately where relevant.
- Best overall: January, February, March, April, September, October, November and December
- Warmest weather: January, February, March and December
- Most sunshine: January
- Wettest months: May, June, July and August, when rainfall is highest.
- Seasonal pattern: A distinct dry season from September to April, with warm summers and mild winters
Frequently asked questions about the climate in Quillota
What is the best time to visit Quillota?
January, February, March, April, September, October, November and December typically offer the most optimal weather in Quillota. In contrast, June tends to have less optimal conditions. Quillota has a distinct dry season from September to April, with warm summers and mild winters.
What temperatures can I expect in Quillota?
Daytime highs range from 16°C (61°F) in July to 26°C (79°F) in January. Nighttime lows range from 4°C (39°F) to 14°C (57°F).
How much rain does Quillota get?
Annual rainfall is around 352 mm (14 in). June is the wettest month with 103 mm (4.1 in), while January is the driest with 1 mm (0.04 in).
How sunny is Quillota?
Quillota receives around 2,129 hours of sunshine per year. January is the sunniest month with 280 hours, while June is the cloudiest with just 80 hours. Overall, Quillota enjoys abundant sunshine.
Quillota 3-Day Forecast
Quillota 3-Day Forecast
Quillota on the map
Quillota is highlighted - select any city to see its climate.
Popular this month
Where to go in July - average daytime high across popular destinations.
Bucket list
Need travel inspiration? Check out our bucket list articles and be inspired.
 The 10 most alternative cities in South America
Discover South America's top 10 alternative cities! From Valparaíso's vibrant streets to La Paz's high-altitude charm and Medellín's innovative spirit.
 Torres del Paine
Torres del Paine is an huge national park on the border with Argentina. It is possible to walk here along craters, high-rising mountain ridges, over glaciers and through vast majestic tundra.
Explore Patagonia
A tour through Patagonia brings you to the end of the world. That’s why Patagonia is a bucket list destination for many. We recommend to visit Patagonia from November to early March.
Enjoy the silence and peace in a spectacular landscape
This lodge guarantees privacy and exclusivity for those seeking to get away from mass tourism and enjoy the silence and peace in a spectacular landscape.