Quercitello Weather & Climate: Best Time to Visit
Quercitello, France, sees big temperature differences between seasons, with August peaking at 28°C (82°F) and February dropping to 12°C (54°F).
The city receives around 915 mm (36 in) of rainfall per year. It experiences a distinct dry season from July to August. November is the wettest month and July the driest. The most sunshine falls in July, with an average of 11.5 hours of daily sunshine.
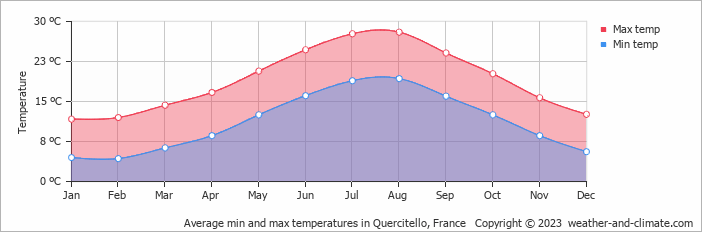
Monthly Temperature in Quercitello
Visitors to Quercitello can expect significant temperature changes throughout the year. On average, daytime temperatures range from a comfortable 28°C (82°F) in August to a chilly 12°C (54°F) in February.
Nighttime temperatures range from 19°C (66°F) in August to 4°C (39°F) in February.Check out our detailed temperature page for more information.
Temperature ranges by month
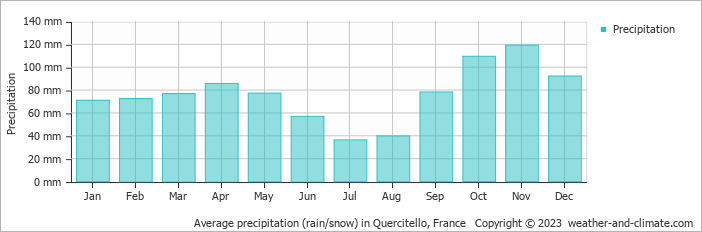
Rainfall in Quercitello
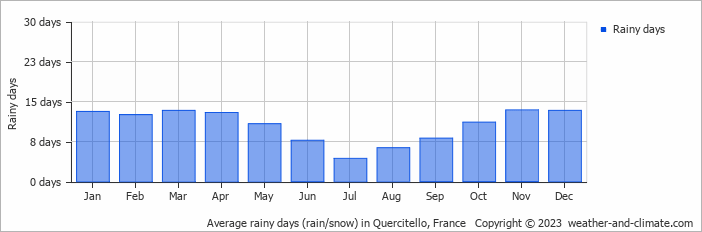
Generally, Quercitello experiences moderate precipitation patterns, averaging 915 mm (36 in) yearly. The seasons in Quercitello bring significant changes in precipitation. The wettest month, November, receives high rainfall, with an average of 119 mm (4.7 in) of precipitation. This rainfall is distributed across 13 rainy days.
In contrast, the driest month, July, experiences much less rainfall, totaling 36 mm (1.4 in) over 4 rainy days. These distinct seasonal differences provide diverse experiences throughout the year. For more details, please visit our Quercitello Precipitation page.The mean monthly precipitation over the year, including rain, hail, and snow
The average number of days each month with precipitation
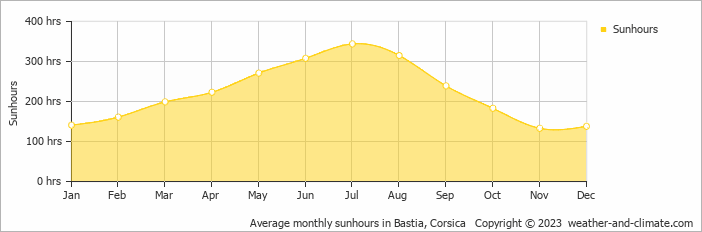
Sunshine Hours in Quercitello
In Quercitello, summer days are longer and more sunny, with daily sunshine hours peaking at 11.5 hours in July. As the darker season arrives, the brightness of the sun becomes less. November sees a soft sun for only 4.4 hours per average day.
Visit our detailed sunshine hours page for more information.
Monthly hours of sunshine
Daily hours of sunshine
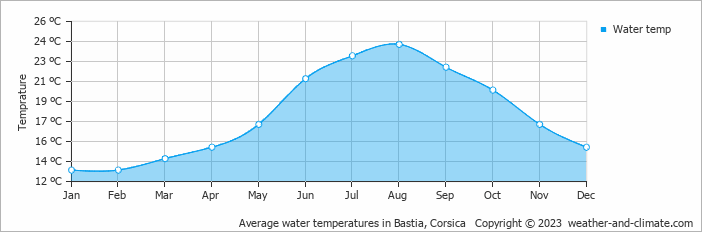
Water Temperature in Quercitello
The mean water temperature over the year ranges from 13°C (55°F) in January to 24°C (75°F) in August.
Water temperature over the year
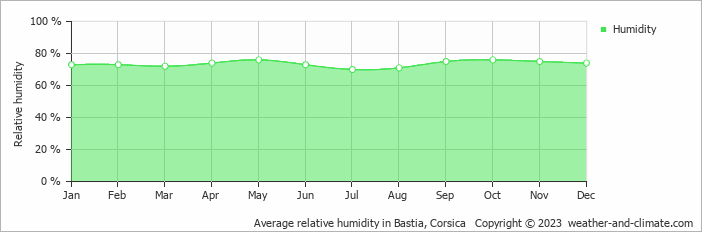
Humidity in Quercitello by Month
The relative humidity is high throughout the year in Quercitello.
The city experiences its highest humidity in May, reaching 76%. In July, the humidity drops to its lowest level at 70%. What does this mean? Read our detailed page on humidity levels for further details.
Relative humidity over the year
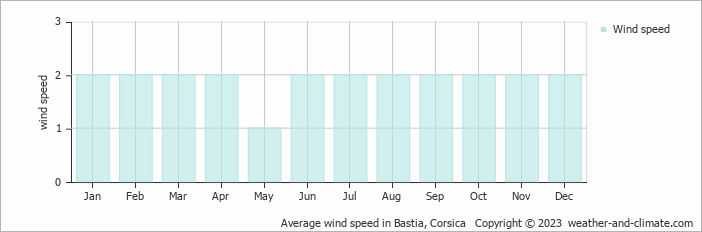
Wind Speed in Quercitello
The mean wind speed over the year ranges from 1 m/s (2 knots) in May to 2 m/s (4 knots) in January, February, March, April, June, July, August, September, October, November and December. What does this mean?
The mean monthly wind speed over the year (meters per second)
Quercitello 3-Day Forecast
Check the conditions for any month of the year.
Best Time to Visit Quercitello
During May, June, July, August, September and October, Quercitello experiences its most favorable weather, with temperatures between 20°C (68°F) and 28°C (82°F). These mild conditions make it an excellent time for a visit.The weather does bring rainfall during this period, between 36 mm (1.4 in) and 109 mm (4.3 in). Seeking the perfect travel destination for this year? We've created a tool that suggests locations matching your desired weather. Let our weather planner guide your travel decisions.