Phra Khanong Weather & Climate: Best Time to Visit
Average temperatures, rainfall, sunshine and the best time to visit Phra Khanong.
Climate overview of Phra Khanong
Phra Khanong, Thailand, has a stable climate with little temperature variation across the year. Average daytime temperatures hover around 34°C (93°F), peaking in April at 36°C (97°F) and dipping in December to 33°C (91°F).
With around 1258 mm (50 in) of annual rainfall, Phra Khanong has a notably wet climate. However, this rainfall is not evenly distributed — the city has a distinct dry season from December to February. The wettest month is September. Sunshine peaks in January, when the city sees around 9.1 hours of sunshine per day.
Phra Khanong Weather by Month
Pick a month to see the average temperature, rainfall and sunshine in Phra Khanong — and find the best time to visit.
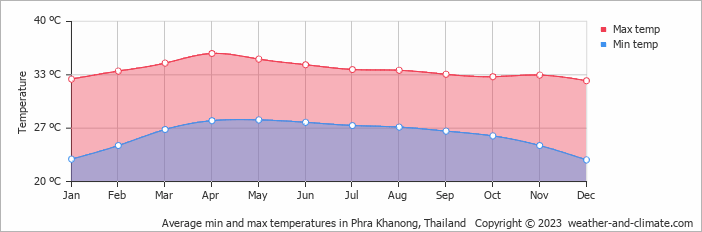
Monthly Temperature in Phra Khanong
With minimal seasonal shifts, Phra Khanong experiences a constant climate year-round. Average daytime temperatures reach a very hot 36°C (97°F) in April. In December, the coolest month of the year, temperatures drop to a very warm 33°C (91°F).
At night, temperatures range from around 28°C (82°F) in April to 23°C (73°F) in December.
Check out our detailed temperature page for more information.
Temperature ranges by month
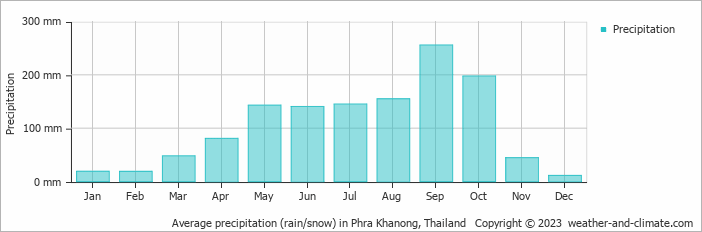
Rainfall in Phra Khanong
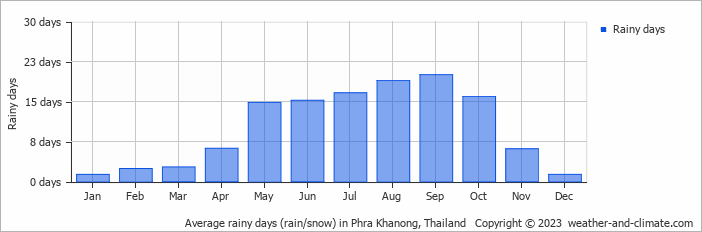
Phra Khanong has a notably wet climate with abundant precipitation, recording 1258 mm (50 in) of rainfall per year. Phra Khanong can be quite wet during September, receiving approximately 256 mm (10 in) of precipitation over 20 rainy days.
In contrast, during the driest month (December), you will experience much drier conditions, with 11 mm (0.4 in) of precipitation spread across a single rainy day days. For more details, please visit our Phra Khanong Precipitation page.
The mean monthly precipitation over the year, including rain, hail, and snow
The average number of days each month with precipitation
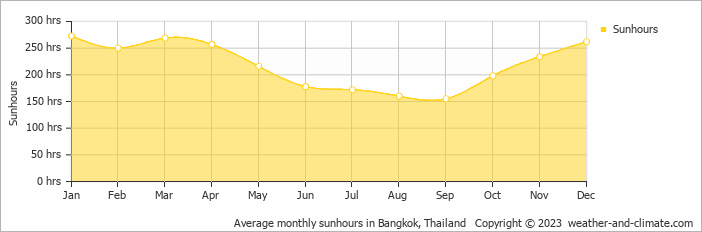
Sunshine Hours in Phra Khanong
Phra Khanong can be enjoyed more throughout the sunniest month of January under a blue sky, with approximately 9.1 hours of sunshine daily. In contrast, the city experiences much darker days in September, with only 5.2 hours of sunlight per day.
Visit our detailed sunshine hours page for more information.
Monthly hours of sunshine
Daily hours of sunshine
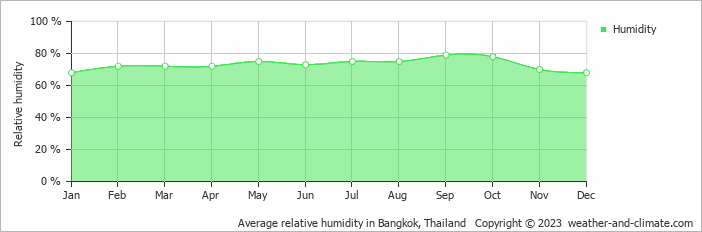
Humidity in Phra Khanong by Month
The relative humidity is high throughout the year in Phra Khanong.
The city experiences its highest humidity in September, reaching 79%. In January, the humidity drops to its lowest level at 68%. What does this mean? Read our detailed page on humidity levels for further details.
Relative humidity over the year
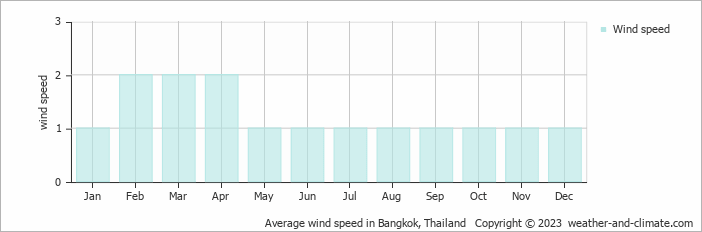
Wind Speed in Phra Khanong
The mean wind speed varies between 1 m/s (2 knots) and 2 m/s (4 knots) throughout the year. It is lowest in January, May, June, July, August, September, October, November and December and highest during February, March and April. What does this mean?
The mean monthly wind speed over the year (meters per second)
Best Time to Visit Phra Khanong
Note that September and October constitute the wet season, bringing characteristic heavy rains. Planning your next adventure but unsure where to go? Our climate tool suggests perfect locations tailored to your preferred weather conditions. Discover your ideal travel destination with our weather planner.
Frequently asked questions about the climate in Phra Khanong
What is the best time to visit Phra Khanong?
January and December typically offer the most optimal weather in Phra Khanong. In contrast, February, March, April, May, June, July, August, September and October tend to have less optimal conditions. Phra Khanong has a distinct dry season from December to February.
What temperatures can I expect in Phra Khanong?
Daytime highs range from 33°C (91°F) in December to 36°C (97°F) in April. Nighttime lows range from 23°C (73°F) to 28°C (82°F). Temperatures stay relatively stable year-round.
How much rain does Phra Khanong get?
Annual rainfall is around 1258 mm (50 in). September is the wettest month with 256 mm (10 in), while December is the driest with 11 mm (0.4 in).
How sunny is Phra Khanong?
Phra Khanong receives around 2,624 hours of sunshine per year. January is the sunniest month with 273 hours, while September is the cloudiest with just 155 hours. Overall, Phra Khanong enjoys abundant sunshine.
Phra Khanong 3-Day Forecast
Phra Khanong 3-Day Forecast
Phra Khanong on the map
Phra Khanong is highlighted — select any city to see its climate.
Popular this month
Where to go in July — average daytime high across popular destinations.
Bucket list
Need travel inspiration? Check out our bucket list articles and be inspired.
 Discover Kok Kood: a hidden gem in Thailand
Discover the hidden gem of Thailand - Koh Kood! Explore stunning beaches, waterfalls and eco-friendly resorts while enjoying a peaceful atmosphere away from the crowds.
Discover Thailand: An Ultimate Guide for Yogis
Explore Thailand's best for yogis: serene retreats, spiritual growth, and adventure. Dive into yoga, meditation, and nature's tranquility for an unforgettable journey.
Trekking in Northern Thailand
One of the most beautiful attractions in Thailand is trekking along mountain villages north of Chiang Mai. The best time to trek is November until February.
Elephant Haven in Thailand: Kindred Spirit Sanctuary
Explore the Kindred Spirit Elephant Sanctuary in Thailand. Experience hiking, observe elephants in nature, and see the positive impact on the community.