



















 The 10 most charming villages in France
Discover France's top 10 beautiful villages. From Normandy to the Côte d'Azur, experience quaint squares and cobbled streets. Which one will you visit this summer?
Average temperatures, rainfall, sunshine and the best time to visit Ozillac.
 –
–
Ozillac, France, sees big temperature differences between seasons, with August peaking at 28°C (82°F) and January dropping to 11°C (52°F).
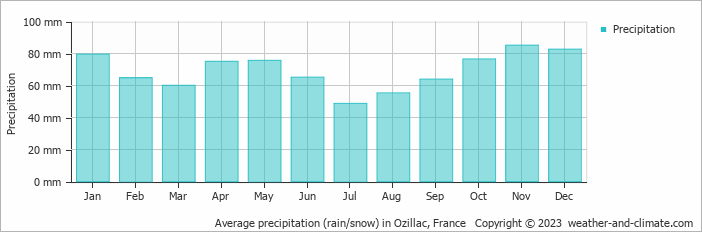
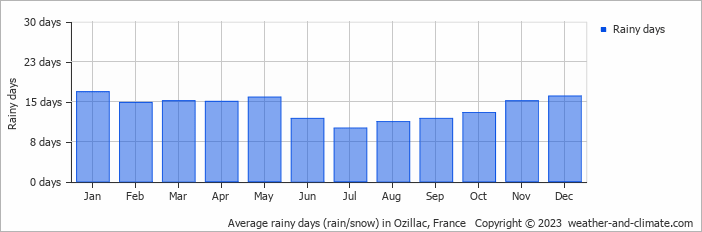
Annual rainfall is moderate at around 832 mm (33 in), with November being the wettest month. The city also has warm summers and cold winters. The sunniest month is July, with 8.3 hours of sunshine per day on average.
Pick a month to see the average temperature, rainfall and sunshine in Ozillac - and find the best time to visit.
Visitors to Ozillac can expect significant temperature changes throughout the year. Average daytime temperatures reach a comfortable 28°C (82°F) in August. In January, the coolest month of the year, temperatures drop to a chilly 11°C (52°F).
At night, temperatures range from around 16°C (61°F) in August to 3°C (37°F) in January.
Check out our detailed temperature page for more information.

Generally, Ozillac experiences moderate precipitation patterns, averaging 832 mm (33 in) yearly. Ozillac experiences moderate seasonal variation in rainfall, with monthly averages ranging from 85 mm (3.3 in) in November, the wettest month, and 49 mm (1.9 in) in July, the driest month. For more details, please visit our Ozillac Precipitation page.
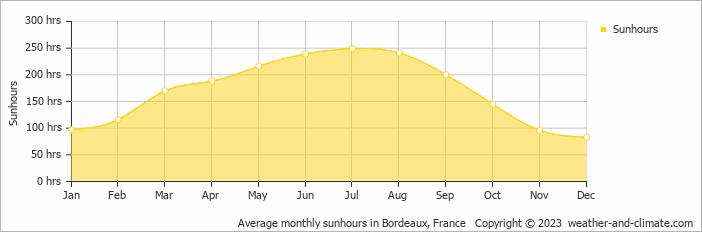
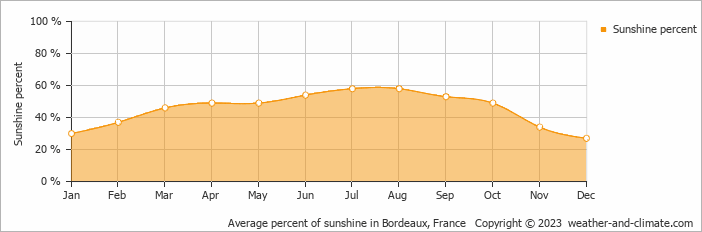
Ozillac can be enjoyed more throughout the sunniest month of July under a blue sky, with approximately 8.3 hours of sunshine daily. In contrast, the city experiences much darker days in December, with only 2.8 hours of sunlight per day.
Visit our detailed sunshine hours page for more information.
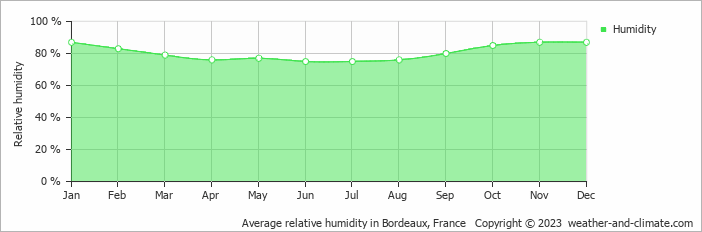
The city experiences its highest humidity in January, reaching 87%. In June, the humidity drops to its lowest level at 75%. What does this mean? Read our detailed page on humidity levels for further details.
Monthly ratings reflect general weather comfort, based on daytime temperature and rainfall. Swimming and winter conditions are highlighted separately where relevant.
May, June, July, August, September and October typically offer the most optimal weather in Ozillac. In contrast, January, February and December tend to have less optimal conditions. Ozillac has warm summers and cold winters.
Daytime highs range from 11°C (52°F) in January to 28°C (82°F) in August. Nighttime lows range from 3°C (37°F) to 16°C (61°F). Temperatures vary considerably through the year.
Annual rainfall is around 832 mm (33 in). November is the wettest month with 85 mm (3.3 in), while July is the driest with 49 mm (1.9 in).
Ozillac receives around 2,040 hours of sunshine per year. July is the sunniest month with 249 hours, while December is the cloudiest with just 83 hours. Overall, Ozillac enjoys abundant sunshine.
Ozillac is highlighted - select any city to see its climate.
Where to go in September - average daytime high across popular destinations.
Need travel inspiration? Check out our bucket list articles and be inspired.
The 10 most charming villages in France
Discover France's top 10 beautiful villages. From Normandy to the Côte d'Azur, experience quaint squares and cobbled streets. Which one will you visit this summer?
 An alternative way to discover Paris
From street art, vintage shops, vegetarian cafes, to amazing cultural events, Paris has much to offer for the creative traveler. An overview of sights that you must see if you want to visit this city in an alternative way.
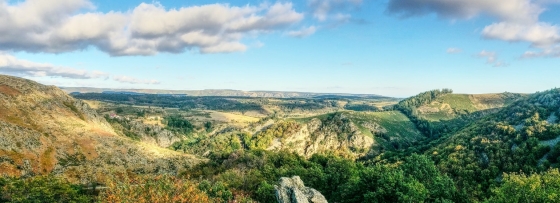 Nature is allowed to take its course in the Ardeche
The Ardèche is France at its most beautiful. The authentic villages and breathtaking mountainous landscapes are one of the main reasons. he climate in Ardèche is very pleasant. Temperatures are high during summer and it is often very sunny.

 Explore the natural wonders of Corsica
Corsica offers an abundance of incredible natural wonders to explore. This stunning Mediterranean island is a paradise for outdoor enthusiasts and nature lovers alike.