Oranjestad Weather & Climate: Best Time to Visit
Oranjestad, Aruba, enjoys a steady climate throughout the year, with daytime temperatures typically around 29°C (84°F). September is the warmest month at 30°C (86°F), while January is the coolest at 27°C (81°F).
Annual rainfall is moderate at around 649 mm (26 in), with November being the wettest month. The city also has a distinct dry season from February to August.
Monthly Temperature in Oranjestad
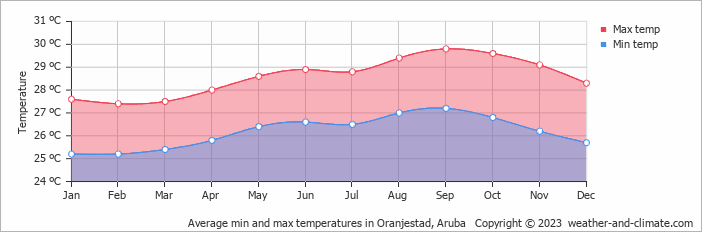
The temperature in Oranjestad remains steady throughout the year, providing a consistently comfortable climate. Average daytime temperatures reach a comfortable 30°C (86°F) in September. In January, the coolest month of the year, temperatures drop to a comfortable 27°C (81°F).
At night, temperatures range from around 27°C (81°F) in September to 25°C (77°F) in January.
Check out our detailed temperature page for more information.
Temperature ranges by month
Rainfall in Oranjestad
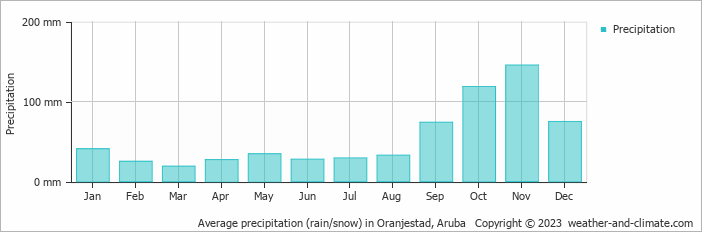
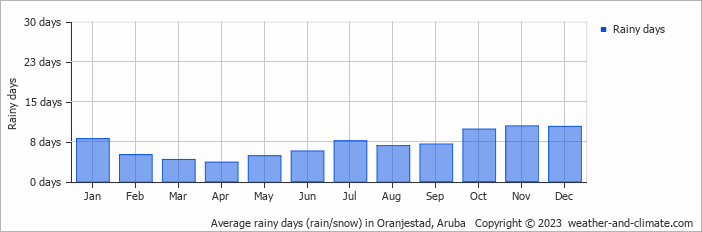
Generally, Oranjestad has a moderate amount of precipitation, averaging 649 mm (26 in) of rainfall annually. Oranjestad can be quite wet during November, receiving approximately 145 mm (5.7 in) of precipitation over 10 rainy days.
In contrast, during the driest month (March), you will experience much drier conditions, with 19 mm (0.7 in) of precipitation spread across 4 rainy days days. For more details, please visit our Oranjestad Precipitation page.
The mean monthly precipitation over the year, including rain, hail, and snow
The average number of days each month with precipitation
Water Temperature in Oranjestad
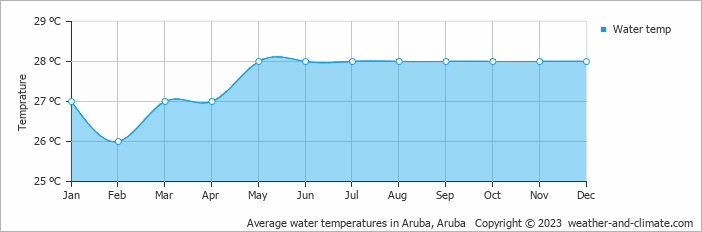
The mean water temperature over the year ranges from 26°C (79°F) in February to 28°C (82°F) in May.
Water temperature over the year
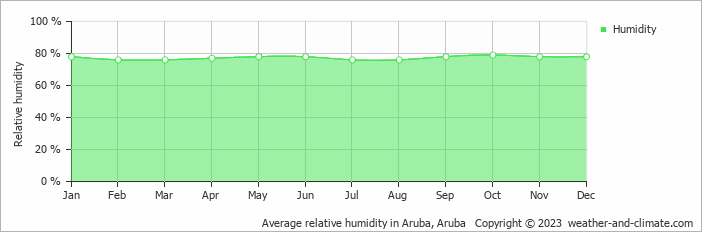
Humidity in Oranjestad by Month
The relative humidity is high throughout the year in Oranjestad.
The city experiences its highest humidity in October, reaching 79%. In February, the humidity drops to its lowest level at 76%. What does this mean? Read our detailed page on humidity levels for further details.
Relative humidity over the year
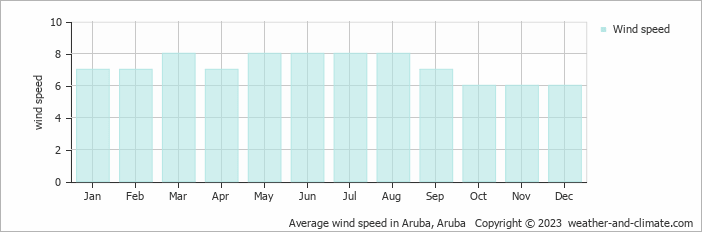
Wind Speed in Oranjestad
The mean wind speed over the year ranges from 6 m/s (12 knots) in October, November and December to 8 m/s (16 knots) in March, May, June, July and August. What does this mean?
The mean monthly wind speed over the year (meters per second)
Oranjestad 3-Day Forecast
Check the conditions for any month of the year.
Best Time to Visit Oranjestad
Oranjestad offers comfortable weather throughout the entire year, with temperatures consistently ranging from 27°C (81°F) to 30°C (86°F) across all twelve months. This exceptional climate stability makes it a year-round destination, though the drier months provide the best visiting conditions.Rainfall varies from 19 mm (0.7 in) in March to 145 mm (5.7 in) in November. The drier months like March offer the most pleasant conditions for exploring the area. Planning your next adventure but unsure where to go? Our climate tool suggests perfect locations tailored to your preferred weather conditions. Discover your ideal travel destination with our weather planner.