Natori Weather & Climate: Best Time to Visit
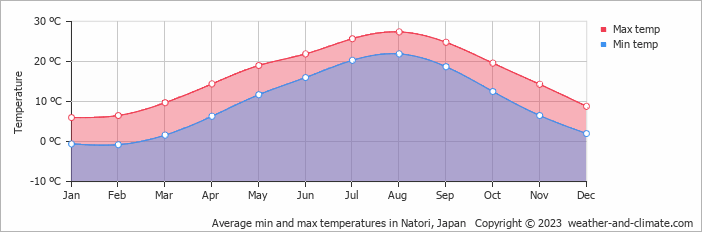
Natori, Miyagi, Japan, sees big temperature differences between seasons, with August peaking at 27°C (81°F) and February dropping to 6°C (43°F).
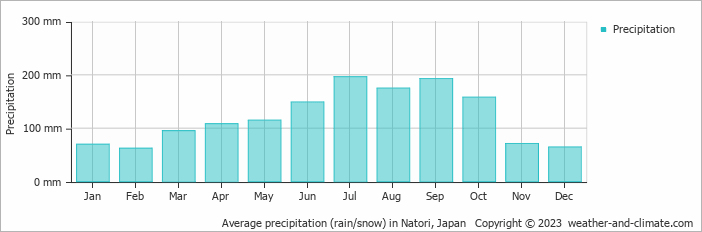
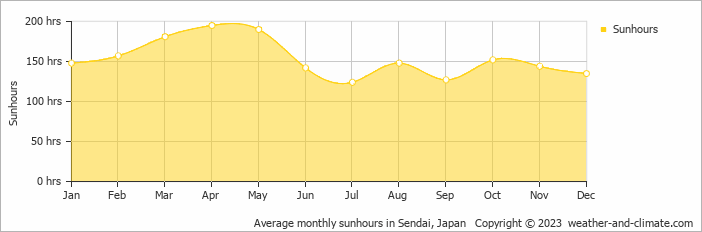
Rain/snowfall is high, totalling around 1456 mm (57 in) per year. July is the wettest month and February the driest. The city also experiences a distinct rainy season from July to September. April is the sunniest month, averaging 6.5 hours of sunshine per day.
Monthly Temperature in Natori
Visitors to Natori can expect significant temperature changes throughout the year. Average maximum daytime temperatures range from a comfortable 27°C (81°F) in August, the warmest time of the year, to a chilly 6°C (43°F) during cooler months like February.
At night, you can expect temperatures ranging from 22°C (72°F) in August to around -1°C (30°F) during February.
Check out our detailed temperature page for more information.
Temperature ranges by month
Rainfall in Natori
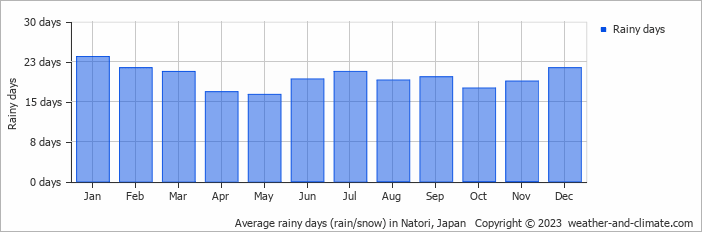
Natori is known for its substantial rain/snowfall, with annual precipitation reaching 1456 mm (57 in). Significant seasonal changes in precipitation occur throughout the year. In the wettest month, July it receives heavy rainfall, averaging 196 mm (7.7 in) of precipitation, recorded across 21 rainy days. In contrast, the driest month February brings less snow/rainfall, with 62 mm (2.4 in) over 21 snowy/rainy days. For more details, please visit our Natori Precipitation page.
The mean monthly precipitation over the year, including rain, hail, and snow
The average number of days each month with precipitation
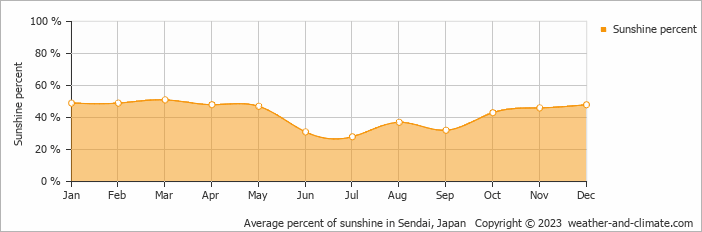
Sunshine Hours in Natori
While the amount of sunshine in Natori varies throughout the year, all seasons offer their own charm. Enjoy up to 6.5 hours of daily sun in April, and experience slightly darker atmosphere in July, with about 4.1 hours of daily sunlight.
Visit our detailed sunshine hours page for more information.
Monthly hours of sunshine
Daily hours of sunshine
Daily percentage of sunshine
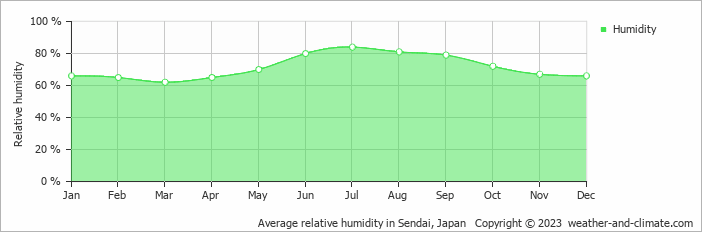
Humidity in Natori by Month
The relative humidity is high throughout the year in Natori.
The city experiences its highest humidity in July, reaching 84%. In March, the humidity drops to its lowest level at 62%. What does this mean? Read our detailed page on humidity levels for further details.
Relative humidity over the year
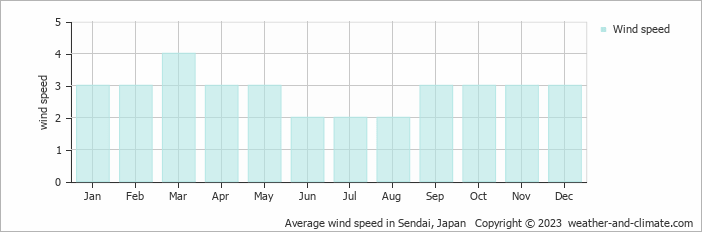
Wind Speed in Natori
The mean wind speed over the year ranges from 2 m/s (4 knots) in June, July and August to 4 m/s (8 knots) in March. What does this mean?
The mean monthly wind speed over the year (meters per second)
Natori 3-Day Forecast
Check the conditions for any month of the year.
Best Time to Visit Natori
During May, June and October, Natori experiences its most favorable weather, with temperatures between 19°C (66°F) and 22°C (71°F). These mild conditions make it an excellent time for a visit.The weather does bring rainfall during this period, between 115 mm (4.5 in) and 158 mm (6.2 in).
Plan accordingly for July, August and September, when conditions bring the heaviest precipitation. Need help choosing your next travel destination? We offer a specialized tool that matches you with locations based on your weather preferences. Explore destinations that suit your climate preferences.