














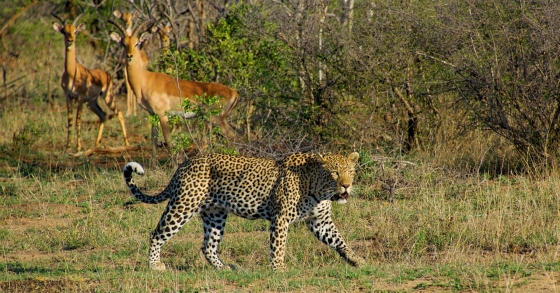
 Visit Kruger Park in South Africa
Are you going to South Africa, then you cannot skip the Kruger Park. The Kruger Park is one of the most beautiful and largest safari parks in the world.
Average temperatures, rainfall, sunshine and the best time to visit Marrupa.
 –
–
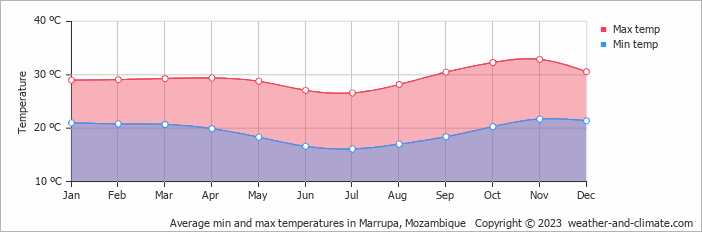
The climate in Marrupa, Mozambique, is remarkably consistent, with temperatures year-round averaging 29°C (84°F). The warmest month is November at 33°C (91°F), and the coolest is July at 27°C (81°F).
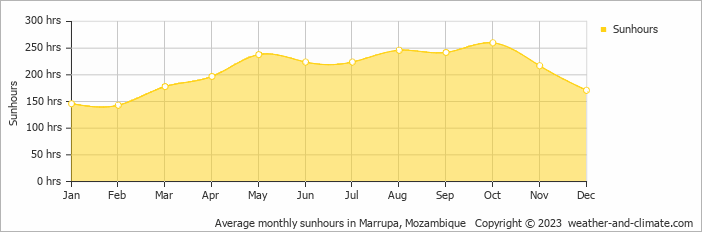
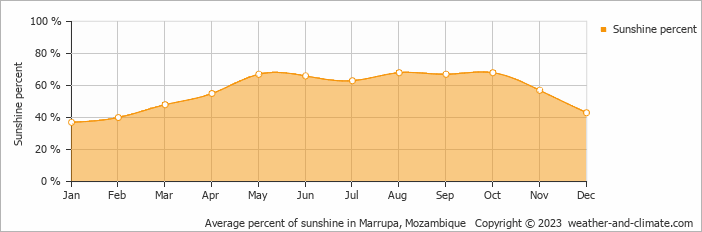
The city has a wet climate, receiving around 1079 mm (42 in) of rainfall per year. Despite the high annual total, it has distinct dry (May to October) and wet (December to February) seasons. January is the wettest month. Sunshine peaks in October, when the city sees around 8.7 hours of sunshine per day.
Pick a month to see the average temperature, rainfall and sunshine in Marrupa - and find the best time to visit.
In Marrupa temperatures are generally consistent throughout the year. On average, daytime temperatures range from a very warm 33°C (91°F) in November to a comfortable 27°C (81°F) in July.
Nighttime temperatures range from 22°C (72°F) in November to 16°C (61°F) in July.
Check out our detailed temperature page for more information.
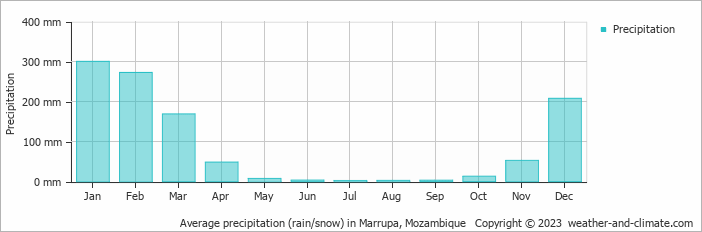
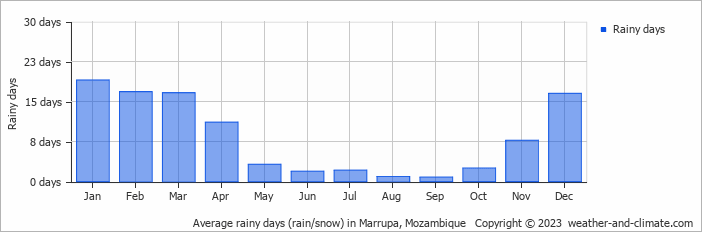
Marrupa experiences significant rainfall throughout the year, averaging 1079 mm (42 in) of precipitation annually. The seasons in Marrupa bring significant changes in precipitation. The wettest month, January, receives heavy rainfall, with an average of 300 mm (12 in) of precipitation. This rainfall is distributed across 19 rainy days.
In contrast, the driest month, July, experiences much less rainfall, totaling 2.1 mm (0.1 in) over 2 rainy days. These distinct seasonal differences provide diverse experiences throughout the year. For more details, please visit our Marrupa Precipitation page.
In Marrupa, summer days are longer and more sunny, with daily sunshine hours peaking at 8.7 hours in October. As the darker season arrives, the brightness of the sun becomes less. February sees a soft sun for only 4.8 hours per average day.
Visit our detailed sunshine hours page for more information.
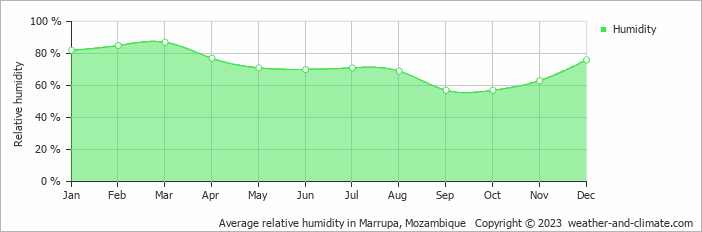
The relative humidity is high throughout the year in Marrupa.
The city experiences its highest humidity in March, reaching 87%. In September, the humidity drops to its lowest level at 57%. What does this mean? Read our detailed page on humidity levels for further details.
Monthly ratings reflect general weather comfort, based on daytime temperature and rainfall. Swimming and winter conditions are highlighted separately where relevant.
April, May, June, July and August typically offer the most optimal weather in Marrupa. In contrast, January, February and December tend to have less optimal conditions. Marrupa has distinct dry (May to October) and wet (December to February) seasons.
Daytime highs range from 27°C (81°F) in July to 33°C (91°F) in November. Nighttime lows range from 16°C (61°F) to 22°C (72°F). Temperatures stay relatively stable year-round.
Annual rainfall is around 1079 mm (42 in). January is the wettest month with 300 mm (12 in), while July is the driest with 2.1 mm (0.1 in).
Marrupa receives around 2,486 hours of sunshine per year. October is the sunniest month with 260 hours, while February is the cloudiest with just 143 hours. Overall, Marrupa enjoys abundant sunshine.
Marrupa is highlighted - select any city to see its climate.
Where to go in October - average daytime high across popular destinations.
 Beira
Beira 30°C (86°F) Pemba31°C (88°F) Ilha de Moçambique29°C (84°F) Vilanculos29°C (84°F) Chidenguele28°C (82°F) Maputo
 27°C (81°F) Tofo26°C (79°F) Miramar26°C (79°F)
 Need travel inspiration? Check out our bucket list articles and be inspired.
Visit Kruger Park in South Africa
Are you going to South Africa, then you cannot skip the Kruger Park. The Kruger Park is one of the most beautiful and largest safari parks in the world.
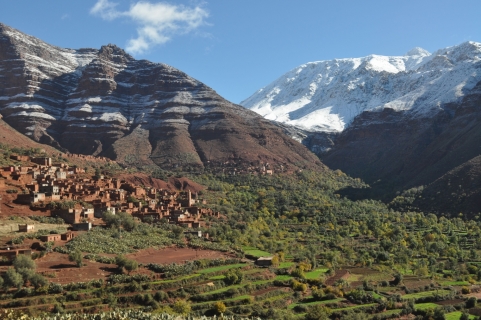
 The Atlas Mountains in Morocco
This mountain range is the second highest mountains in the world and is certainly one of the most natural and wonderful mountains you could ever visit. One for the bucket list for sure.
 One of South Africa's most spectacular private game reserves
Sabi Sand Game Reserve is one of South Africa's most spectacular private game reserves. The chance that you see the entire Big Five is high in winter (June - August).

 The 10 best wildlife viewing sites in Kenya
Explore Kenya's top 10 safari parks in this guide, featuring the Maasai Mara, Amboseli, and more, for a spectacular wildlife adventure