Marrupa Precipitation: Average Monthly Rainfall and Snowfall
This graph shows the average amount of rainfall per month in Marrupa (). The numbers are calculated over a 30-year period to provide a reliable average.
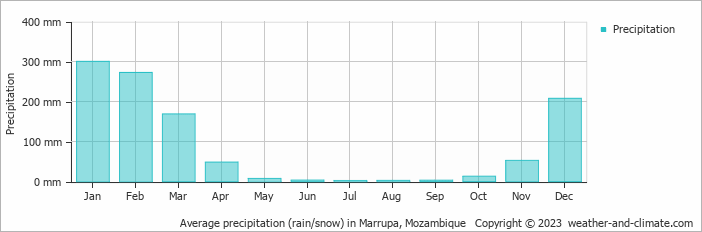
- A lot of rain (rainy season) falls in the months: January, February, March and December.
- Marrupa has dry periods in May, June, July, August, September and October.
- On average, January is the wettest month with 300 mm of precipitation.
- On average, July is the driest month with 2 mm of precipitation.
- The average amount of annual precipitation is 1079 mm.
Current rainfall in Marrupa
Thu Nov 21
34°C | 20°C
SE  11 km/h
11 km/h2.6 mm
partly cloudy and thunder
Fri Nov 22
31°C | 21°C
NW 7 km/h
7 km/h10 mm
broken clouds and thunder
Sat Nov 23
30°C | 20°C
N 11 km/h
11 km/h1.1 mm
partly cloudy and thunder