Maria Farinha Weather & Climate: Best Time to Visit
Average temperatures, rainfall, sunshine and the best time to visit Maria Farinha.
Climate overview of Maria Farinha
The climate in Maria Farinha, Pernambuco, Brazil, is remarkably consistent, with temperatures year-round averaging 29°C (84°F). The warmest month is March at 31°C (88°F), and the coolest is August at 28°C (82°F).
The city receives considerable rainfall, with around 1094 mm (43 in) annually. June is the wettest month. The most sunshine falls in November, with an average of 8.9 hours of daily sunshine.
Maria Farinha Weather by Month
Pick a month to see the average temperature, rainfall and sunshine in Maria Farinha — and find the best time to visit.
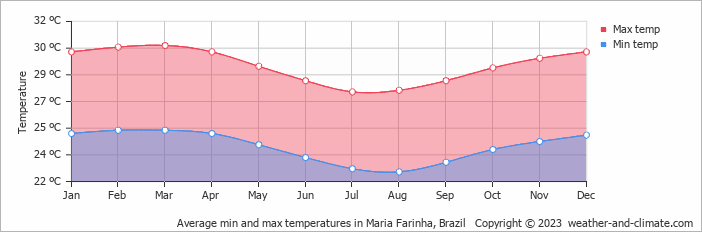
Monthly Temperature in Maria Farinha
In Maria Farinha temperatures are generally consistent throughout the year. Typically, average maximum daytime temperatures range from a very warm 31°C (88°F) in March to a comfortable 28°C (82°F) in the coolest month, August.
Nights vary from 25°C (77°F) in March to around 23°C (73°F) during the colder months.
Check out our detailed temperature page for more information.
Temperature ranges by month
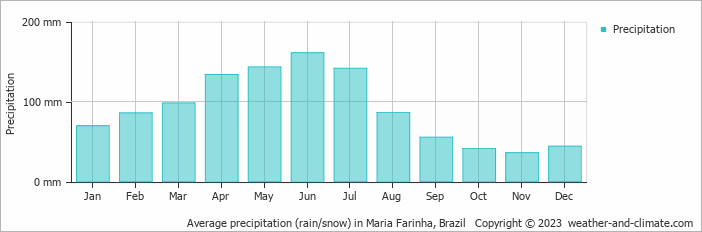
Rainfall in Maria Farinha
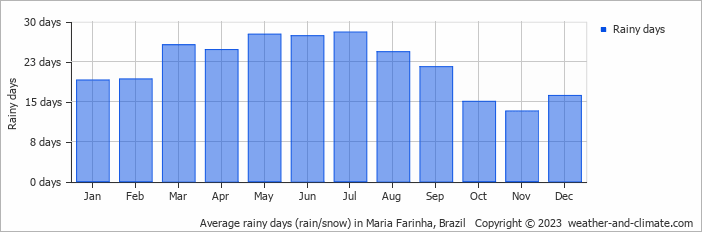
Maria Farinha experiences significant rainfall throughout the year, averaging 1094 mm (43 in) of precipitation annually. The climate in Maria Farinha shows significant variation throughout the year. Expect heavy rainfall in June, the wettest month, with an average of 161 mm (6.3 in) of precipitation over 27 rainy days.
In contrast, the driest month November offers drier and sunnier days, with around 36 mm (1.4 in) of rainfall over 13 rainy days. For more details, please visit our Maria Farinha Precipitation page.
The mean monthly precipitation over the year, including rain, hail, and snow
The average number of days each month with precipitation
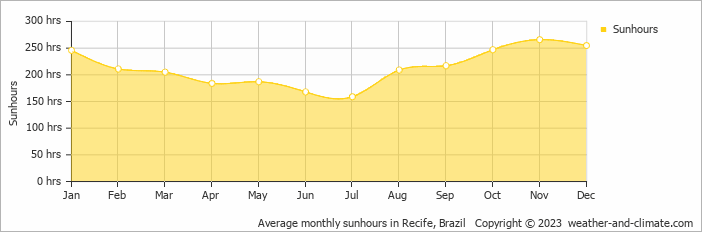
Sunshine Hours in Maria Farinha
For those who appreciate different seasons, Maria Farinha serves as an ideal destination. Expect longer, more sun-filled days in November with an average of 8.9 hours of sunshine daily, and embrace the darker days in July, offering only 5.3 hours of daily sunlight.
Visit our detailed sunshine hours page for more information.
Monthly hours of sunshine
Daily hours of sunshine
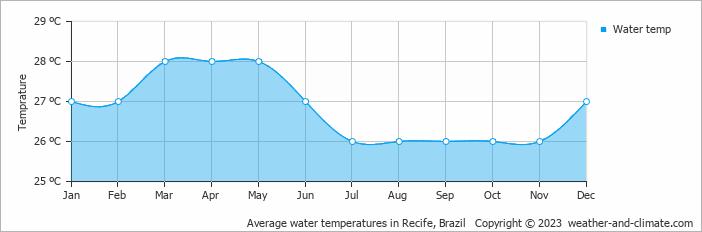
Water Temperature in Maria Farinha
The mean water temperature over the year ranges from 26°C (79°F) in July to 28°C (82°F) in March.
Water temperature over the year
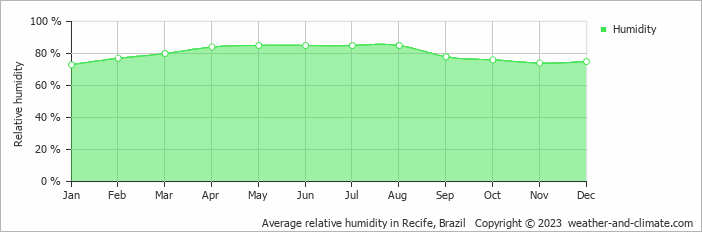
Humidity in Maria Farinha by Month
The relative humidity is high throughout the year in Maria Farinha.
The city experiences its highest humidity in May, reaching 85%. In January, the humidity drops to its lowest level at 73%. What does this mean? Read our detailed page on humidity levels for further details.
Relative humidity over the year
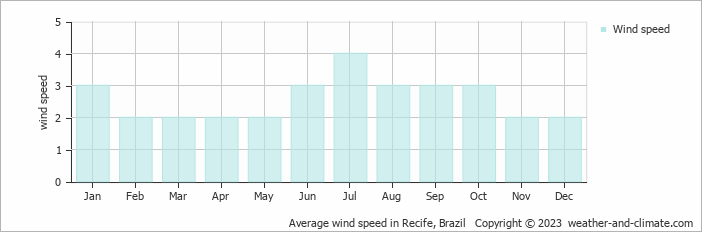
Wind Speed in Maria Farinha
The mean wind speed varies between 2 m/s (4 knots) and 4 m/s (8 knots) throughout the year. It is lowest in February, March, April, May, November and December and highest during July. What does this mean?
The mean monthly wind speed over the year (meters per second)
Best Time to Visit Maria Farinha
To make the most of your visit, consider exploring early in the morning or during the pleasant late afternoon hours when the temperature is most comfortable.
Be aware that June has significant precipitation. Planning your next adventure but unsure where to go? Our climate tool suggests perfect locations tailored to your preferred weather conditions. Discover your ideal travel destination with our weather planner.
Frequently asked questions about the climate in Maria Farinha
What is the best time to visit Maria Farinha?
August, September and October typically offer the most optimal weather in Maria Farinha. In contrast, April tends to have less optimal conditions.
What temperatures can I expect in Maria Farinha?
Daytime highs range from 28°C (82°F) in August to 31°C (88°F) in March. Nighttime lows range from 23°C (73°F) to 25°C (77°F). Temperatures stay relatively stable year-round.
How much rain does Maria Farinha get?
Annual rainfall is around 1094 mm (43 in). June is the wettest month with 161 mm (6.3 in), while November is the driest with 36 mm (1.4 in).
How sunny is Maria Farinha?
Maria Farinha receives around 2,554 hours of sunshine per year. November is the sunniest month with 266 hours, while July is the cloudiest with just 159 hours. Overall, Maria Farinha enjoys abundant sunshine.
Maria Farinha 3-Day Forecast
Maria Farinha 3-Day Forecast
Maria Farinha on the map
Maria Farinha is highlighted — select any city to see its climate.
Popular this month
Where to go in June — average daytime high across popular destinations.
Bucket list
Need travel inspiration? Check out our bucket list articles and be inspired.
 The 10 most alternative cities in South America
Discover South America's top 10 alternative cities! From Valparaíso's vibrant streets to La Paz's high-altitude charm and Medellín's innovative spirit.
 The 5 most tranquil retreats in the Amazon Rainforest, Brazil
Discover top sustainable lodges in the Amazon. Enjoy unique wildlife, eco-friendly stays, and immersive experiences at Anavilhanas, Cristalino, and more.
An alternative way to discover Rio de Janeiro
Don't feel like seeing the traditional tourist sights in Rio de Janeiro? We have made an overview of the sights in Rio de Janeiro that you must see if you want to visit Rio in an alternative way.
Iguazu Falls
Iguazu Falls are among the largest waterfalls on earth. You will be speechless when you see this miracle of mother nature. They are included in the World Heritage List and have also been named one of the seven wonders of the world.