Mamoan Weather and Climate: A Comprehensive Guide
Mamoan has a steady warm climate throughout the year.
It also has a relatively rainy climate with high levels of precipitation.
Let’s explore the climate details in depth to provide you with a complete overview.
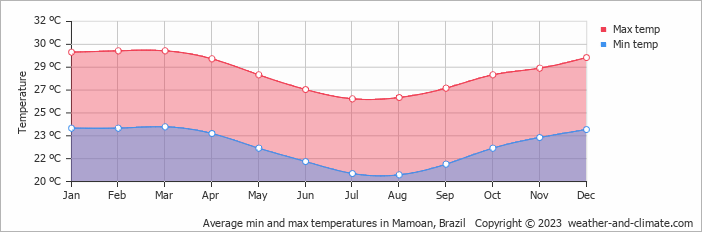
Average maximum day and minimum night temperature
In Mamoan temperatures are generally consistent throughout the year. On average, daytime temperatures range from a comfortable 30°C in February to a comfortable 26°C in August.
Nighttime temperatures can drop, with average lows reaching 21°C in August.Check out our detailed temperature page for more information.
Temperature ranges by month
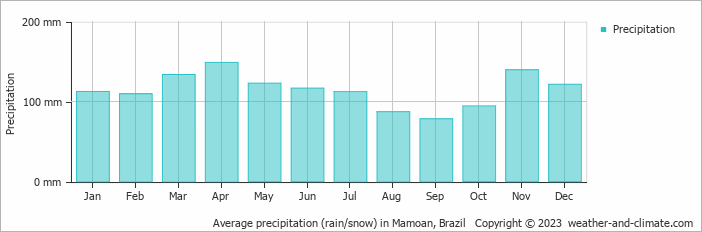
Precipitation and rainy days
Mamoan experiences significant rainfall throughout the year, averaging 1375 mm of precipitation annually. The amount of precipitation varies moderately throughout the year. The wettest month, April, sees around 149 mm of rainfall, perfect for those who enjoy a bit of rain now and then. The driest month, September, still receives a respectable 78 mm of rainfall.
The mean monthly precipitation over the year, including rain, hail and snow
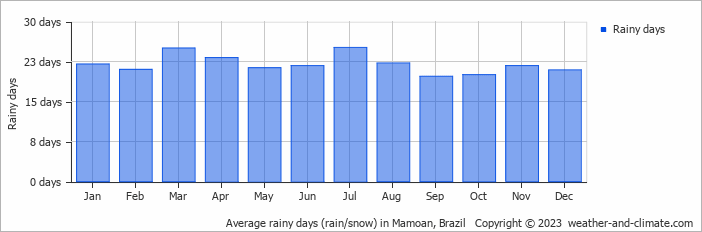
The average number of days each month with precipitation
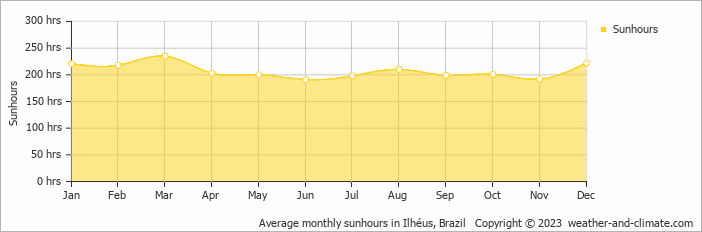
Sunshine over the year
The sunniest days in Mamoan occur in March, with around 7.8 hours of daily sunshine. Even in June, the least sunny month, Mamoan doesn't shy away from the sun, still enjoying a comfortable 6.4 hours of daily sunlight.
Visit our detailed sunshine hours page for more information.
Monthly hours of sunshine
Daily hours of sunshine
Average humidity
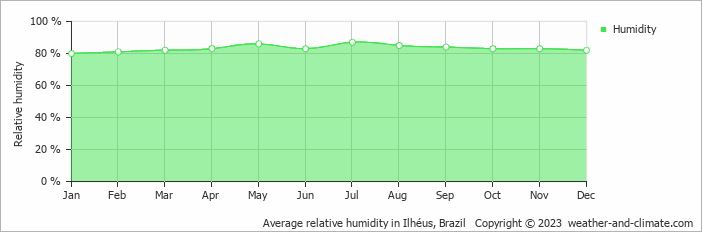
The city experiences its highest humidity in July, reaching 87%. In January, the humidity drops to its lowest level at 80%. What does this mean? Read our detailed page on humidity levels for further details.
Relative humidity over the year
Forecast for Mamoan


Select a Month of Interest
Check the conditions for any month of the year.
The best time of year to visit Mamoan in Brazil
Other facts from our historical weather data:February has an average maximum temperature of 30°C and is the warmest month of the year.
The coldest month is August with an average maximum temperature of 26°C.
April tops the wettest month list with 149 mm of rainfall.
September is the driest month with 78 mm of precipitation.
March is the sunniest month with an average of 235 hours of sunshine.
No idea where to travel to this year? We have a tool that recommends destinations based on your ideal conditions. Find out where to go with our weather planner.


