Mamoan Precipitation: Average Monthly Rainfall and Snowfall
This graph shows the average amount of rainfall per month in Mamoan (). The numbers are calculated over a 30-year period to provide a reliable average.
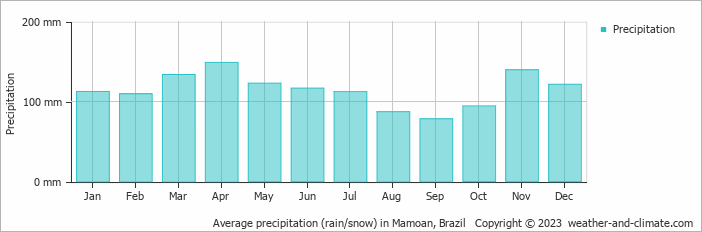
- A lot of rain (rainy season) falls in the months: January, February, March, April, May, June, July, November and December.
- On average, April is the wettest month with 149 mm of precipitation.
- On average, September is the driest month with 78 mm of precipitation.
- The average amount of annual precipitation is 1376 mm.
Current rainfall in Mamoan
Wed Dec 11
32°C | 20°C
N  14 km/h
14 km/hpartly cloudy and no rain
Thu Dec 12
31°C | 22°C
NE 14 km/h
14 km/h4.1 mm
broken clouds and rain
Fri Dec 13
31°C | 22°C
E 14 km/h
14 km/h1.2 mm
broken clouds and slight rain