Los Mochis, Mexico - Weather and Climate
Temperatures in Los Mochis, Sinaloa, Mexico, see a moderate degree of fluctuation,
transitioning from very hot conditions
to warm.
It typically sees modest rainfall throughout the year.
Let’s explore the climate details to provide you with a complete overview.
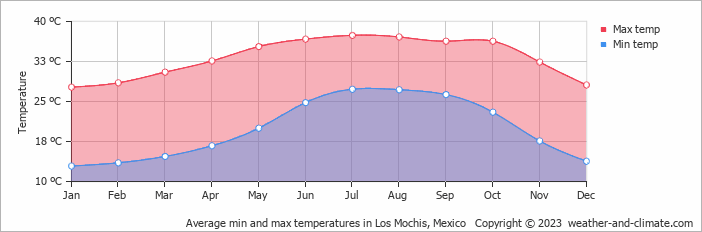
Average maximum day and minimum night temperature
In Los Mochis, seasonal changes bring about a moderate variation in temperatures. Typically, average maximum daytime temperatures range from a very hot 37°C in July to a comfortable 28°C in the coolest month, January.
Nights are cooler, with lows often dropping to around 13°C during the colder months.Check out our detailed temperature page for more information.
Temperature ranges by month
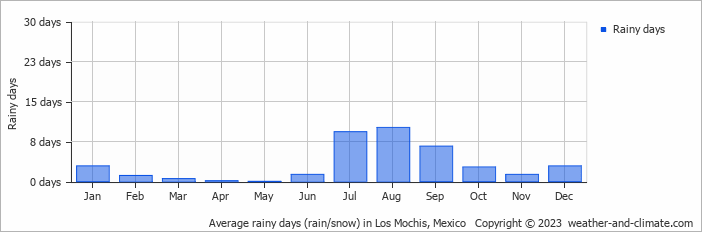
Precipitation and rainy days
Los Mochis typically sees modest rainfall throughout the year, with an average annual precipitation of 377 mm. The climate in Los Mochis shows significant variation throughout the year. Expect high rainfall in September, with an average of 113 mm of precipitation over 7 rainy days.
In contrast, May offers drier and sunnier days, with around 0.4 mm of rainfall over 0 rainy days. For more details, please visit our Los Mochis Precipitation page.The mean monthly precipitation over the year, including rain, hail and snow

The average number of days each month with precipitation
Forecast for Los Mochis


Select a Month of Interest
Check the conditions for any month of the year.
The best time of year to visit Los Mochis in Mexico
Other facts from our historical weather data:July has an average maximum temperature of 37°C and is the hottest month of the year.
The coolest month is January with an average maximum temperature of 28°C.
September tops the wettest month list with 113 mm of rainfall.
May is the driest month with 0 mm of precipitation.
No idea where to travel to this year? We have a tool that recommends destinations based on your ideal conditions. Find out where to go with our weather planner.


