Monthly Average Rainy days in Los Mochis
The number of days each month with rain, snow and hail in Los Mochis (Sinaloa), Mexico.
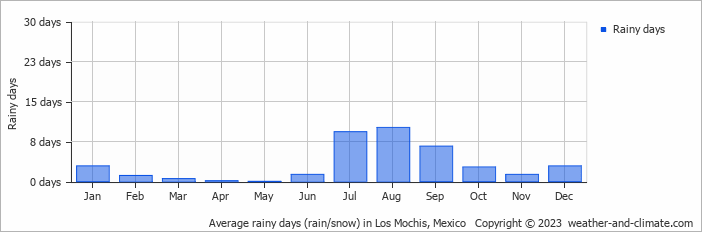
- Los Mochis has dry periods in February, March, April, May, June and November.
- On average, August is the most rainy with 10 days of rain/snow.
- On average, May is the driest month with 0 rainy days.
- The average annual number of rainy days is 38.
Current rainfall in Los Mochis
Wed Jan 15
24°C | 13°C
NW  5 m/s
5 m/s
5 m/spartly cloudy and no rain
Thu Jan 16
24°C | 13°C
NW 6 m/s
6 m/sbroken clouds and no rain
Fri Jan 17
24°C | 14°C
NW 6 m/s
6 m/sbroken clouds and no rain


