Lo de Marcos Weather & Climate: Best Time to Visit
Average temperatures, rainfall, sunshine and the best time to visit Lo de Marcos.
Climate overview of Lo de Marcos
The climate in Lo de Marcos, Mexico, is remarkably consistent, with temperatures year-round averaging 29°C (84°F). The warmest month is July at 31°C (88°F), and the coolest is January at 27°C (81°F).
The city has a wet climate, receiving around 1052 mm (41 in) of rainfall per year. Despite the high annual total, it has distinct dry (November to May) and wet (July to September) seasons. September is the wettest month.
Lo de Marcos Weather by Month
Pick a month to see the average temperature, rainfall and sunshine in Lo de Marcos — and find the best time to visit.
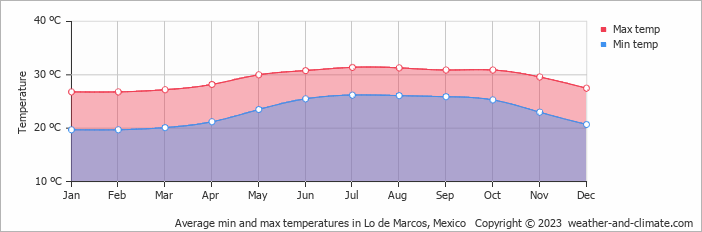
Monthly Temperature in Lo de Marcos
In Lo de Marcos temperatures are generally consistent throughout the year. On average, daytime temperatures range from a very warm 31°C (88°F) in July to a comfortable 27°C (81°F) in January.
Nighttime temperatures range from 26°C (79°F) in July to 20°C (68°F) in January.
Check out our detailed temperature page for more information.
Temperature ranges by month
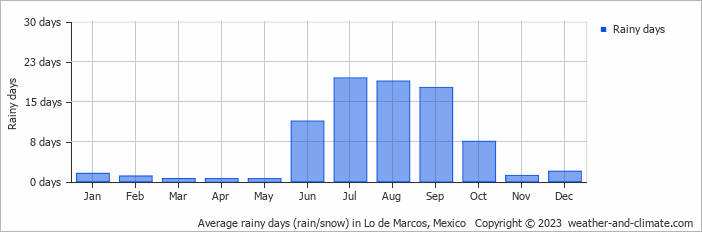
Rainfall in Lo de Marcos
Lo de Marcos experiences significant rainfall throughout the year, averaging 1052 mm (41 in) of precipitation annually. The seasons in Lo de Marcos bring significant changes in precipitation. The wettest month, September, receives heavy rainfall, with an average of 270 mm (11 in) of precipitation. This rainfall is distributed across 18 rainy days.
In contrast, the driest month, April, experiences much less rainfall, totaling 2 mm (0.1 in) over a single rainy day. These distinct seasonal differences provide diverse experiences throughout the year. For more details, please visit our Lo de Marcos Precipitation page.
The mean monthly precipitation over the year, including rain, hail, and snow

The average number of days each month with precipitation
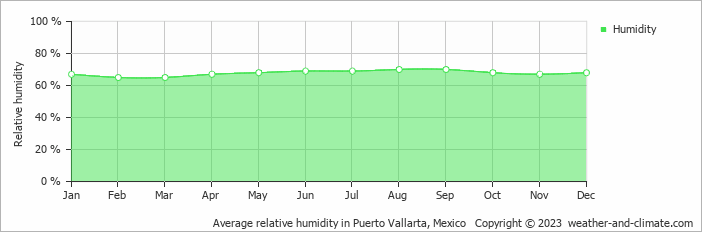
Humidity in Lo de Marcos by Month
The relative humidity is high throughout the year in Lo de Marcos.
The city experiences its highest humidity in August, reaching 70%. In February, the humidity drops to its lowest level at 65%. What does this mean? Read our detailed page on humidity levels for further details.
Relative humidity over the year
Best Time to Visit Lo de Marcos
To make the most of your visit, consider exploring early in the morning or during the pleasant late afternoon hours when the temperature is most comfortable.
Be aware that July, August and September constitute the rainy season, with significant precipitation. Need help choosing your next travel destination? We offer a specialized tool that matches you with locations based on your weather preferences. Explore destinations that suit your climate preferences.
Frequently asked questions about the climate in Lo de Marcos
What is the best time to visit Lo de Marcos?
January, February, March, April and December typically offer the most optimal weather in Lo de Marcos. In contrast, July, August and September tend to have less optimal conditions. Lo de Marcos has distinct dry (November to May) and wet (July to September) seasons.
What temperatures can I expect in Lo de Marcos?
Daytime highs range from 27°C (81°F) in January to 31°C (88°F) in July. Nighttime lows range from 20°C (68°F) to 26°C (79°F). Temperatures stay relatively stable year-round.
How much rain does Lo de Marcos get?
Annual rainfall is around 1052 mm (41 in). September is the wettest month with 270 mm (11 in), while April is the driest with 2 mm (0.1 in).
Lo de Marcos 3-Day Forecast
Lo de Marcos 3-Day Forecast
Lo de Marcos on the map
Lo de Marcos is highlighted — select any city to see its climate.
Popular this month
Where to go in June — average daytime high across popular destinations.
Bucket list
Need travel inspiration? Check out our bucket list articles and be inspired.
 Explore the Majestic Copper Canyons of Mexico
Explore the vast Copper Canyons in Chihuahua, Mexico—larger than the Grand Canyon. Discover scenic train rides, hikes, and the Tarahumara people.
These are the most beautiful Mayan ruins and Mayan temples in Mexico
Mexico is a destination where you can immerse yourself in ancient cultures and civilizations. In this article we have listed our favorite Mayan ruins.
Tips, to-do's and nicest restaurants in Mexico City
Mexico City, one of the most famous and notorious cities of the world. The best time to visit is between March and May, but it can be visited year round.
Zihuatanejo: A Pacific paradise with beautiful beaches
Zihuatanejo has some of Mexico's top beaches. Unlike other off-the-beaten-path destinations in Mexico, Zihua is very accessible and sustainable.