Le Morne Weather & Climate: Best Time to Visit
Average temperatures, rainfall, sunshine and the best time to visit Le Morne.
Climate overview of Le Morne
Le Morne, Rodrigues, Mauritius, has a stable climate with little temperature variation across the year. Average daytime temperatures hover around 27°C (81°F), peaking in February at 29°C (84°F) and dipping in August to 24°C (75°F).
Annual rainfall is moderate at around 866 mm (34 in), with February being the wettest month. The city also has a distinct dry season from June to October. December is the sunniest month, averaging 9.6 hours of sunshine per day.
Le Morne Weather by Month
Pick a month to see the average temperature, rainfall and sunshine in Le Morne - and find the best time to visit.
Monthly Temperature in Le Morne
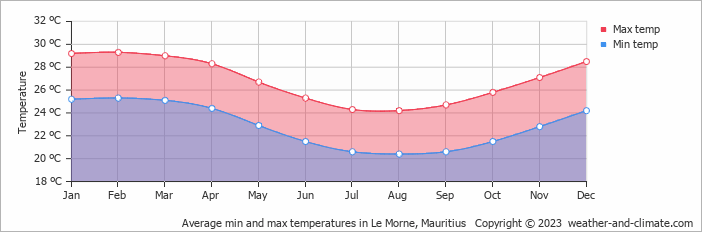
With minimal seasonal shifts, Le Morne experiences a constant climate year-round. Average daytime temperatures reach a comfortable 29°C (84°F) in February. In August, the coolest month of the year, temperatures drop to a comfortable 24°C (75°F).
At night, temperatures range from around 25°C (77°F) in February to 20°C (68°F) in August.
Check out our detailed temperature page for more information.
Temperature ranges by month
Rainfall in Le Morne
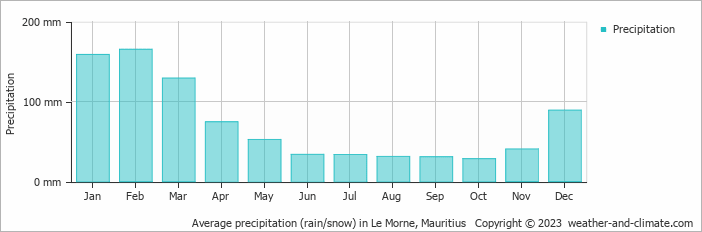
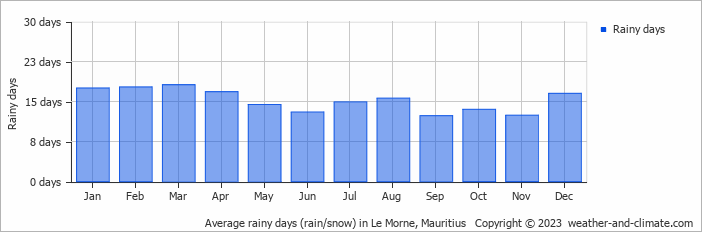
Generally, Le Morne receives mid-range precipitation levels, with 866 mm (34 in) annually. Le Morne can be quite wet during February, receiving approximately 165 mm (6.5 in) of precipitation over 18 rainy days.
In contrast, during the driest month (October), you will experience much drier conditions, with 28 mm (1.1 in) of precipitation spread across 14 rainy days. For more details, please visit our Le Morne Precipitation page.
The mean monthly precipitation over the year, including rain, hail, and snow
The average number of days each month with precipitation
Sunshine Hours in Le Morne
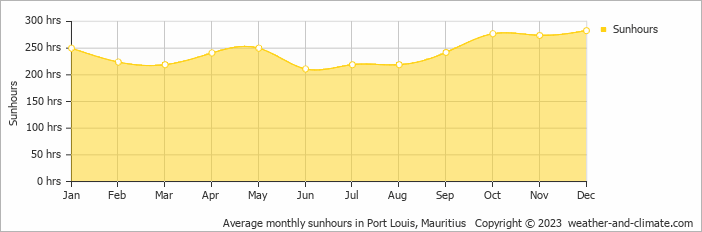
Le Morne experiences moderate variation in sunshine hours across the seasons. With 9.6 hours daily sunshine in December, it dips to 7.2 hours in June, offering a balanced mix of sunny and overcast days.
Visit our detailed sunshine hours page for more information.
Monthly hours of sunshine
Daily hours of sunshine
Wind Speed in Le Morne
The mean wind speed over the year ranges from 5 m/s (10 knots) in January and February to 7 m/s (14 knots) in August. What does this mean?
The mean monthly wind speed over the year (meters per second)

Best Time to Visit Le Morne
Monthly ratings reflect general weather comfort, based on daytime temperature and rainfall. Swimming and winter conditions are highlighted separately where relevant.
- Best overall: April, May, June, July, August, September, October, November and December
- Warmest weather: January, February, March, April and December
- Most sunshine: January and December
- Wettest months: January, February, March, April and December, when rainfall is highest.
- Seasonal pattern: A distinct dry season from June to October
Frequently asked questions about the climate in Le Morne
What is the best time to visit Le Morne?
April, May, June, July, August, September, October, November and December typically offer the most optimal weather in Le Morne. In contrast, January, February and March tend to have less optimal conditions. Le Morne has a distinct dry season from June to October.
What temperatures can I expect in Le Morne?
Daytime highs range from 24°C (75°F) in August to 29°C (84°F) in February. Nighttime lows range from 20°C (68°F) to 25°C (77°F). Temperatures stay relatively stable year-round.
How much rain does Le Morne get?
Annual rainfall is around 866 mm (34 in). February is the wettest month with 165 mm (6.5 in), while October is the driest with 28 mm (1.1 in).
How sunny is Le Morne?
Le Morne receives around 2,956 hours of sunshine per year. December is the sunniest month with 289 hours, while June is the cloudiest with just 215 hours. Overall, Le Morne enjoys abundant sunshine.
Le Morne 3-Day Forecast
Le Morne on the map
Le Morne is highlighted - select any city to see its climate.
Popular this month
Where to go in July - average daytime high across popular destinations.
Bucket list
Need travel inspiration? Check out our bucket list articles and be inspired.
