Le Morne Sunshine Hours by Month
Sunshine is key to understanding how a place experiences its seasons. This page shows the total number of hours of direct sunlight per month and the average hours per day in Le Morne, Rodrigues, Mauritius. These values are calculated using 30 years of data (1990–2020) to ensure accuracy.
Monthly hours of sunshine
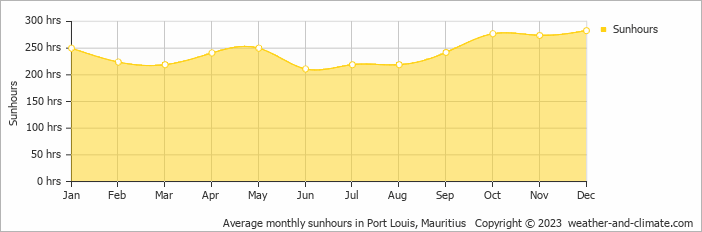
While the amount of sunshine in Le Morne changes moderately throughout the year, the annual total remains impressive at around 2969 hours. Expect slightly brighter days in December and a subtle dip in June.
Daily hours of sunshine
Enjoy up to 9.6 hours of daily sun in December, and experience slightly darker atmosphere in June, with about 7.2 hours of daily sunlight.
Le Morne vs Major Cities: Sunshine Compared
Le Morne enjoys an average of 2969 hours of sunshine annually. Let’s compare this with some popular tourist destinations:
The city of Rome, Italy, experiences 2470 hours of sunshine annually, adding to its charm as a year-round tourist destination.
In contrast, Juneau, Alaska, receives only about 1523 hours of sunshine per year and is known for its very short days in winter and frequently overcast conditions.
In Shanghai, China, the annual average sunshine is 1780 hours, with cloudier weather in summer.
In Tokyo, Japan, the average annual sunshine is 1930 hours, with sunny periods between rainy seasons.
Related Climate Data for Le Morne
February, Le Morne’s wettest month, receives 165 mm (6.5 in) of rainfall and has a maximum daytime temperature of 29°C (84°F). During the driest month October you can expect a temperature of 26°C (79°F).
For more detailed insights into the city’s temperatures, check out our Temperature page. To explore more about precipitation patterns, visit our Le Morne Precipitation page.


