















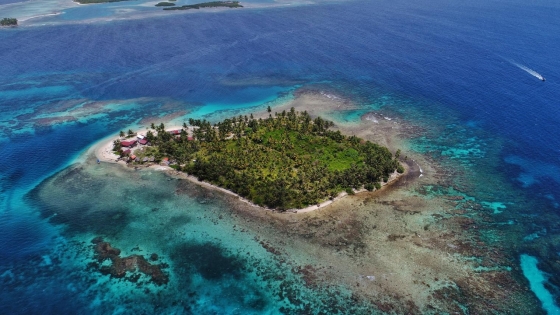
 Discover the San Blas Islands
The San Blas Islands are among the most beautiful islands in the Caribbean and perhaps even in the world. These tropical pearls are located in the north of Panama.
Average temperatures, rainfall, sunshine and the best time to visit Las Tablas.
 –
–
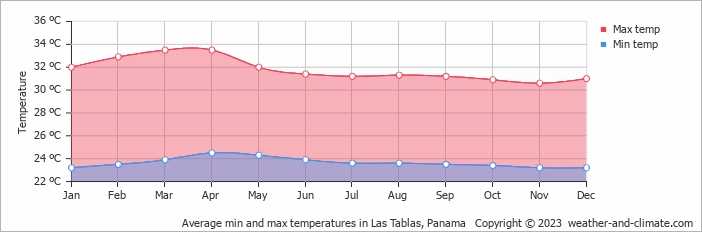
Las Tablas, Los Santos, Panama, enjoys a steady climate throughout the year, with daytime temperatures typically around 32°C (90°F). March is the warmest month at 34°C (93°F), while November is the coolest at 31°C (88°F).
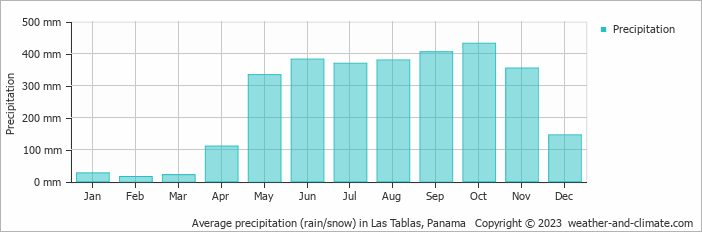
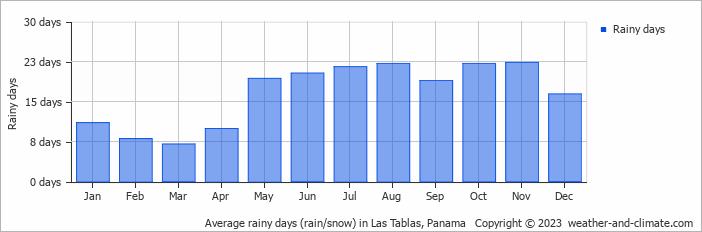
With around 2972 mm (117 in) of annual rainfall, Las Tablas has a notably wet climate. However, this rainfall is not evenly distributed, the city has distinct dry (January to March) and wet (May to November) seasons. The wettest month is October.
Pick a month to see the average temperature, rainfall and sunshine in Las Tablas - and find the best time to visit.
The temperature in Las Tablas remains steady throughout the year, providing a consistently very warm climate. Average daytime temperatures reach a very warm 34°C (93°F) in March. In November, the coolest month of the year, temperatures drop to a very warm 31°C (88°F).
At night, temperatures range from around 25°C (77°F) in March to 23°C (73°F) in November.
Check out our detailed temperature page for more information.
Las Tablas has a relatively rainy climate with high precipitation levels, averaging 2972 mm (117 in) of rainfall annually. Las Tablas can be quite wet during October, receiving approximately 431 mm (17 in) of precipitation over 22 rainy days.
In contrast, during the driest month (February), you will experience much drier conditions, with 15 mm (0.6 in) of precipitation spread across 8 rainy days. For more details, please visit our Las Tablas Precipitation page.
Monthly ratings reflect general weather comfort, based on daytime temperature and rainfall. Swimming and winter conditions are highlighted separately where relevant.
January typically offers the most optimal weather in Las Tablas. In contrast, March, April, May, June, July, August, September, October and November tend to have less optimal conditions. Las Tablas has distinct dry (January to March) and wet (May to November) seasons.
Daytime highs range from 31°C (88°F) in November to 34°C (93°F) in March. Nighttime lows range from 23°C (73°F) to 25°C (77°F). Temperatures stay relatively stable year-round.
Annual rainfall is around 2972 mm (117 in). October is the wettest month with 431 mm (17 in), while February is the driest with 15 mm (0.6 in).
Las Tablas is highlighted - select any city to see its climate.
Where to go in October - average daytime high across popular destinations.
Pedasí 30°C (86°F) Santa Catalina29°C (84°F) Playa Blanca29°C (84°F) Bastimentos29°C (84°F) Panama City30°C (86°F) Bocas del Toro30°C (86°F) Contadora29°C (84°F) Boquete26°C (79°F)
 Need travel inspiration? Check out our bucket list articles and be inspired.
Discover the San Blas Islands
The San Blas Islands are among the most beautiful islands in the Caribbean and perhaps even in the world. These tropical pearls are located in the north of Panama.

 The top 5 unexplored rainforests in Central America
Dive into Central America's top 5 hidden rainforests for an unparalleled journey through vibrant wildlife and diverse landscapes.
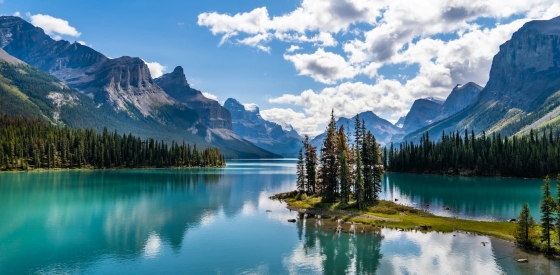
 The 5 most beautiful lakes in Canada
Explore Canada's stunning lakes: Lake Louise, Lake Superior, Maligne Lake, Emerald Lake, and Lake Okanagan, each offering unique beauty and activities.

 Yosemite National Park is definitely worth a visit
Vast forests, blue lakes, towering sequoias, and majestic waterfalls hint at the beauty of Yosemite National Park—a true natural masterpiece.