Kashiba Weather and Climate: A Comprehensive Guide
The temperature in Kashiba can vary greatly throughout the year.
The temperatures shift from very warm
to cold.
It is also known for its large amounts of rain/snowfall.
Now, let’s break down all the climate details for a clearer picture.
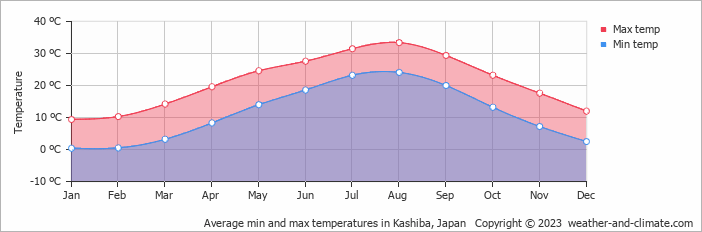
Average maximum day and minimum night temperature
Depending on the time of the year, temperatures range from very warm to chilly in Kashiba. Typically, average maximum daytime temperatures range from a very warm 33°C in August to a chilly 9°C in the coolest month, January.
Nights are cooler, with lows often dropping to around 0°C during the colder months. Check out our detailed temperature page for more information.Temperature ranges by month
Precipitation and rainy days
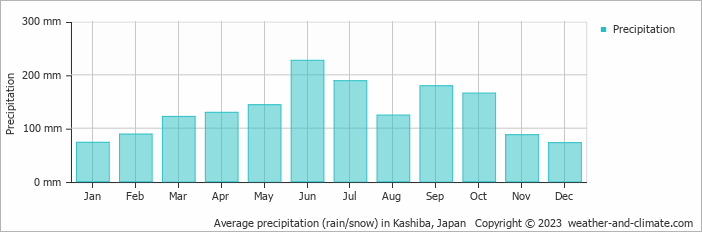
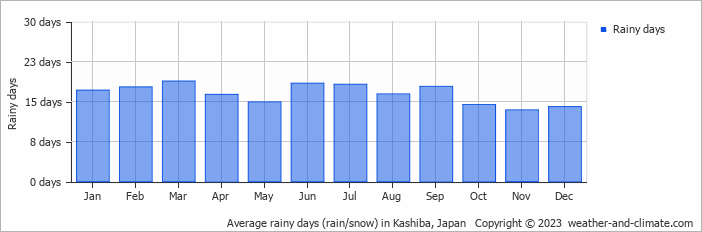
Kashiba has a relatively rain/snowy climate with high precipitation levels, averaging 1601 mm of rain/snowfall annually. The climate in Kashiba shows significant variation throughout the year. Expect heavy rainfall in June, with an average of 227 mm of precipitation over 18 rainy days. In contrast, December offers drier and sunnier days, with around 73 mm of rainfall over 14 rainy days. For more details, please visit our Kashiba Precipitation page.The mean monthly precipitation over the year, including rain, hail and snow
The average number of days each month with precipitation
Sunshine over the year
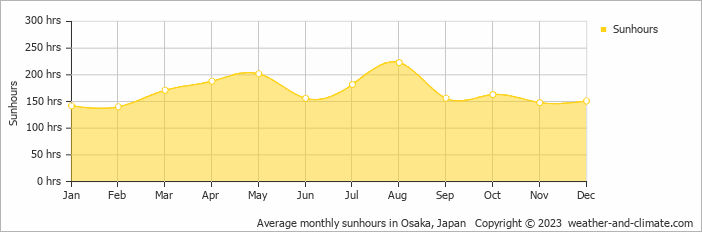
Kashiba offers a pleasant mix of sunny and slightly overcast days. The difference in sunshine hours between August (7.4 hours daily) and February (4.7 hours daily) provides a bit of variety for visitors and residents. Visit our detailed sunshine hours page for more information.Monthly hours of sunshine
Daily hours of sunshine
Average humidity
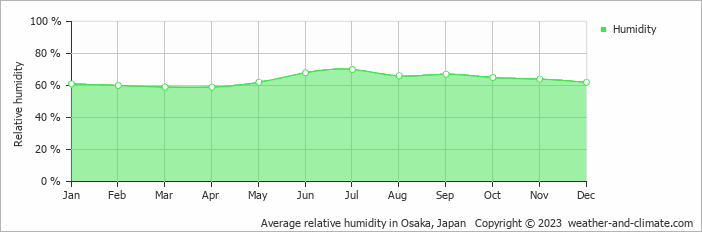
The relative humidity is high throughout the year in Kashiba.
The city experiences its highest humidity in July, reaching 70%. In March, the humidity drops to its lowest level at 59%. What does this mean? Read our detailed page on humidity levels for further details.
Relative humidity over the year
almost clear and no rain overcast and no rain almost clear and no rainForecast for Kashiba
 3 m/s
3 m/s![]() 2 m/s
2 m/s![]() 5 m/s
5 m/s![]()
Select a Month of Interest
Check the conditions for any month of the year.
The best time of year to visit Kashiba in Japan
During the months of May and October you are most likely to experience good weather with pleasant average temperatures that fall between 20°C and 26°C.Other facts from our historical weather data:
Most rainfall (rainy season) is seen in June, July, September and October.
August has an average maximum temperature of 33°C and is the warmest month of the year.
The coldest month is January with an average maximum temperature of 9°C.
June tops the wettest month list with 227 mm of rainfall.
December is the driest month with 73 mm of precipitation.
August is the sunniest month with an average of 223 hours of sunshine.
No idea where to travel to this year? We have a tool that recommends destinations based on your ideal conditions. Find out where to go with our weather planner.