Isla Mujeres Weather & Climate: Best Time to Visit
Average temperatures, rainfall, sunshine and the best time to visit Isla Mujeres.
Climate overview of Isla Mujeres
Isla Mujeres, in Quintana Roo, Mexico, stays warm year-round with little change in temperature. Rainfall is high, especially during the wettest months, when tropical downpours are common. The island is famous for its beaches, reef snorkeling, and relaxed pace. It is just a short ferry ride from Cancún. Now, let’s explore all the climate details to give you a complete picture on when to visit.
Isla Mujeres Weather by Month
Pick a month to see the average temperature, rainfall and sunshine in Isla Mujeres — and find the best time to visit.
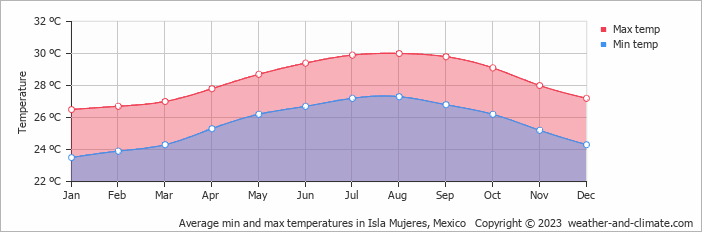
Monthly Temperature in Isla Mujeres
The temperature in Isla Mujeres remains steady throughout the year, providing a consistently very warm climate. Typically, average maximum daytime temperatures range from a very warm 30°C (86°F) in August to a comfortable 27°C (81°F) in the coolest month, January.
Nights vary from 27°C (81°F) in August to around 24°C (75°F) during the colder months.
Check out our detailed temperature page for more information.
Temperature ranges by month
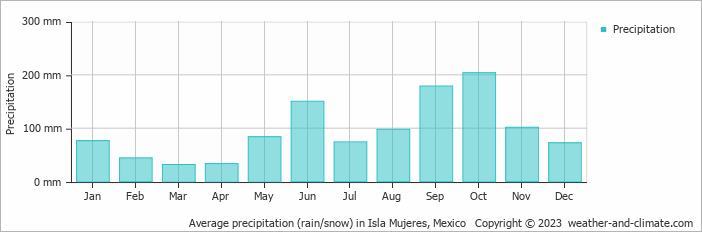
Rainfall in Isla Mujeres
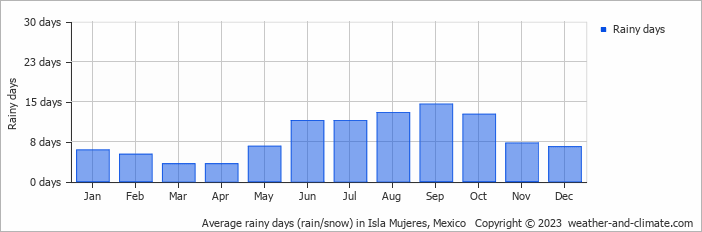
Isla Mujeres has a relatively rainy climate with high precipitation levels, averaging 1146 mm (45 in) of rainfall annually. The climate in Isla Mujeres shows significant variation throughout the year. Expect heavy rainfall in October, the wettest month, with an average of 204 mm (8 in) of precipitation over 13 rainy days.
In contrast, the driest month March offers drier and sunnier days, with around 32 mm (1.3 in) of rainfall over 3 rainy days. For more details, please visit our Isla Mujeres Precipitation page.
The mean monthly precipitation over the year, including rain, hail, and snow
The average number of days each month with precipitation
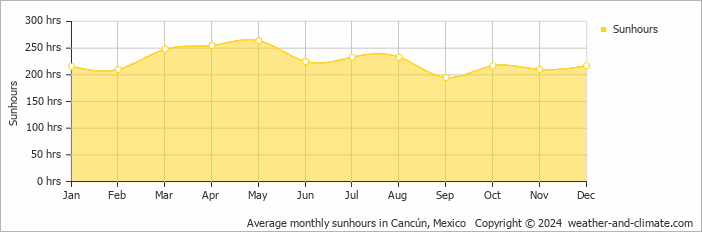
Sunshine Hours in Isla Mujeres
Isla Mujeres offers a pleasant mix of sunny and slightly overcast days. The difference in sunshine hours between May (8.8 hours daily) and September (6.5 hours daily) provides a bit of variety for visitors and residents.
Visit our detailed sunshine hours page for more information.
Monthly hours of sunshine
Daily hours of sunshine
Water Temperature in Isla Mujeres
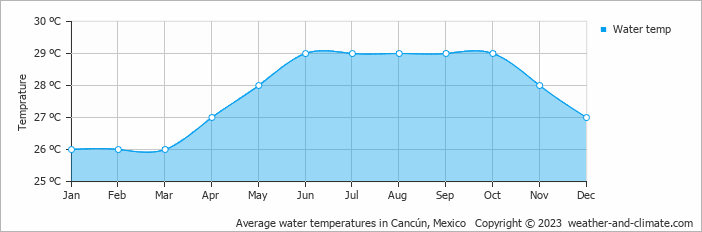
The mean water temperature over the year ranges from 26°C (79°F) in January to 29°C (84°F) in June.
Water temperature over the year
Best Time to Visit Isla Mujeres
For a more comfortable experience, start your day early when the weather is cooler, or take advantage of the gentle breezes in the late afternoon.
The rainy season occurs during September and October, when the area experiences its heaviest rainfall. Wondering where to travel based on your weather preferences? Our recommendation tool helps you find destinations with your ideal climate conditions. Use our weather planner to find your perfect destination.
Frequently asked questions about the climate in Isla Mujeres
What is the best time to visit Isla Mujeres?
January, February, March, April, May and December typically offer the most optimal weather in Isla Mujeres. In contrast, September and October tend to have less optimal conditions. Isla Mujeres has a distinct dry season from March to April.
What temperatures can I expect in Isla Mujeres?
Daytime highs range from 27°C (81°F) in January to 30°C (86°F) in August. Nighttime lows range from 24°C (75°F) to 27°C (81°F). Temperatures stay relatively stable year-round.
How much rain does Isla Mujeres get?
Annual rainfall is around 1146 mm (45 in). October is the wettest month with 204 mm (8 in), while March is the driest with 32 mm (1.3 in).
How sunny is Isla Mujeres?
Isla Mujeres receives around 2,723 hours of sunshine per year. May is the sunniest month with 264 hours, while September is the cloudiest with just 195 hours. Overall, Isla Mujeres enjoys abundant sunshine.
Isla Mujeres 3-Day Forecast
Isla Mujeres 3-Day Forecast
Isla Mujeres on the map
Isla Mujeres is highlighted — select any city to see its climate.
Popular this month
Where to go in July — average daytime high across popular destinations.
Bucket list
Need travel inspiration? Check out our bucket list articles and be inspired.
 Explore the Majestic Copper Canyons of Mexico
Explore the vast Copper Canyons in Chihuahua, Mexico—larger than the Grand Canyon. Discover scenic train rides, hikes, and the Tarahumara people.
These are the most beautiful Mayan ruins and Mayan temples in Mexico
Mexico is a destination where you can immerse yourself in ancient cultures and civilizations. In this article we have listed our favorite Mayan ruins.
Tips, to-do's and nicest restaurants in Mexico City
Mexico City, one of the most famous and notorious cities of the world. The best time to visit is between March and May, but it can be visited year round.
Zihuatanejo: A Pacific paradise with beautiful beaches
Zihuatanejo has some of Mexico's top beaches. Unlike other off-the-beaten-path destinations in Mexico, Zihua is very accessible and sustainable.