Harfleur Weather and Climate: A Comprehensive Guide
The temperature in Harfleur can vary greatly throughout the year.
The temperatures shift from pleasant
to cold.
It also has a relatively rainy climate with high levels of precipitation.
Let's now guide you through the climate details for a complete overview.
Average day and night temperature
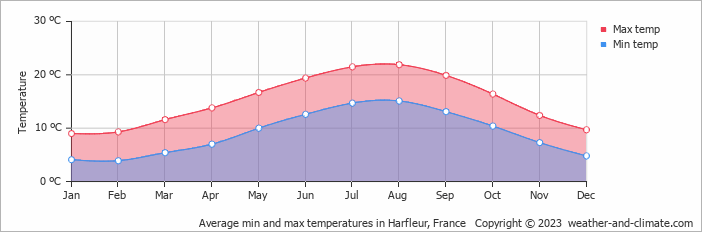
Depending on the time of the year, temperatures range from pleasant to chilly in Harfleur. On average, daytime temperatures range from a pleasant 22°C in August to a chilly 9°C in February. Nighttime temperatures can drop, with averages reaching 4°C in February.
The mean minimum and maximum temperatures throughout the year
Precipitation and rainy days
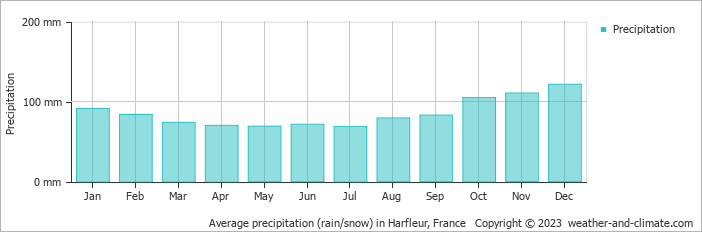
Harfleur has a relatively rainy climate with high precipitation levels, averaging 1026 mm of rainfall annually. The amount of precipitation varies moderately throughout the year. The wettest month, December, sees around 121 mm of rainfall, perfect for those who enjoy a bit of rain now and then. The driest month, July, still receives a respectable 69 mm of rainfall.The mean monthly precipitation over the year, including rain, hail and snow
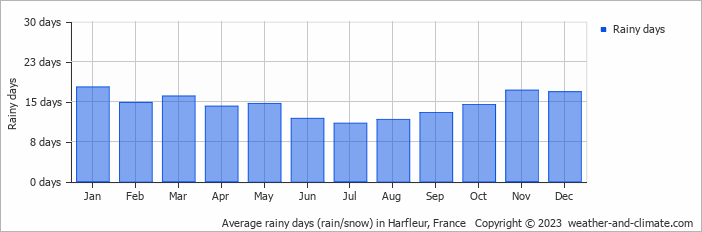
The average number of days each month with precipitation
Sunshine over the year
In Harfleur, summer days are longer and more sunny, with daily sunshine hours peaking at 8.0 hours in July. As the darker season arrives, the brightness of the sun becomes less. December sees a soft sun for only 2.0 hours per average day.Monthly hours of sunshine
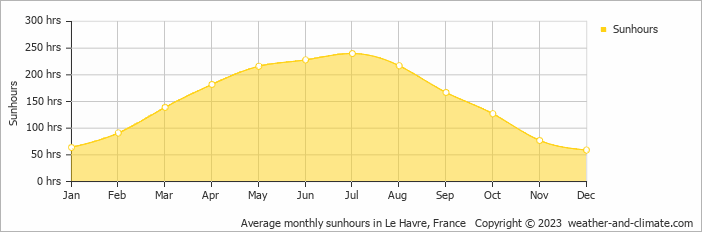
Daily hours of sunshine
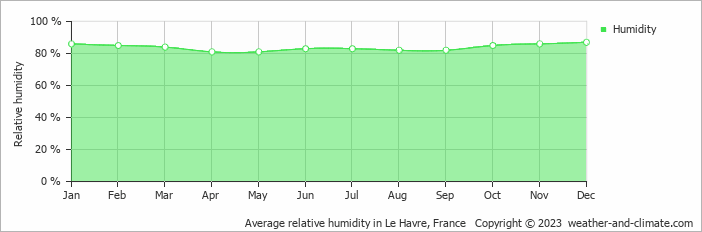
Average humidity
The city experiences its highest humidity in December, reaching 87%. In April, the humidity drops to its lowest level at 81%.
Relative humidity over the year
overcast and no rain overcast and rain partly cloudy and rainForecast for Harfleur
 5 m/s
5 m/s![]() 8 m/s
8 m/s![]() 8 m/s
8 m/s![]()
The best time of year to visit Harfleur in France
During the months of July and August you are most likely to experience good weather with pleasant average temperatures that fall between 20°C and 26°C.Other facts from our historical weather data:
August has an average maximum temperature of 22°C and is the warmest month of the year.
The coldest month is February with an average maximum temperature of 9°C.
December tops the wettest month list with 121 mm of rainfall.
July is the driest month with 69 mm of precipitation.
July is the sunniest month with an average of 240 hours of sunshine.
No idea where to travel to this year? We have a tool that recommends destinations based on your ideal conditions. Find out where to go with our weather planner.