Gwangju Weather & Climate: Best Time to Visit
Average temperatures, rainfall, sunshine and the best time to visit Gwangju.
Climate overview of Gwangju
Gwangju, South Korea, sees big temperature differences between seasons, with August peaking at 31°C (88°F) and January dropping to 6°C (43°F).
Rain/snowfall is high, totalling around 1298 mm (51 in) per year. July is the wettest month and January the driest. The city also experiences distinct dry (December to January) and wet (June to August) seasons. May is the sunniest month, averaging 7.6 hours of sunshine per day.
Gwangju Weather by Month
Pick a month to see the average temperature, rainfall and sunshine in Gwangju — and find the best time to visit.
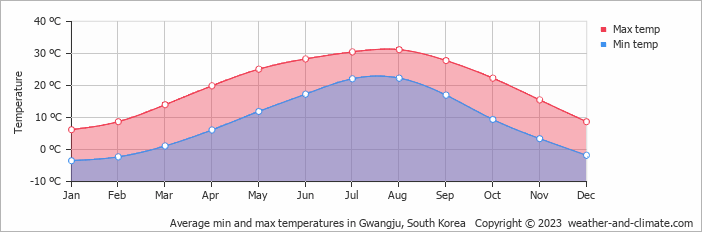
Monthly Temperature in Gwangju
Visitors to Gwangju can expect significant temperature changes throughout the year. Average maximum daytime temperatures range from a very warm 31°C (88°F) in August, the warmest time of the year, to a chilly 6°C (43°F) during cooler months like January.
At night, you can expect temperatures ranging from 22°C (72°F) in August to around -4°C (25°F) during January.
Check out our detailed temperature page for more information.
Temperature ranges by month
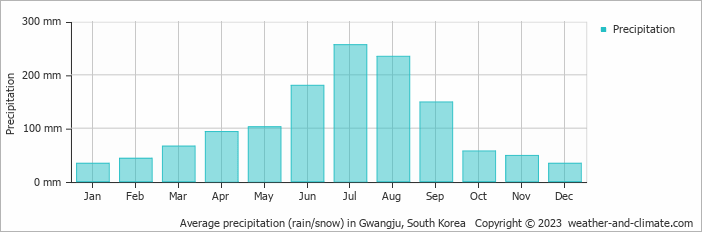
Rainfall in Gwangju
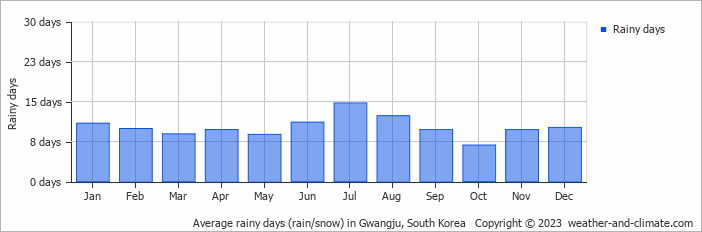
Gwangju is known for its substantial rain/snowfall, with annual precipitation reaching 1298 mm (51 in). Significant seasonal changes in precipitation occur throughout the year. In the wettest month, July it receives heavy rainfall, averaging 256 mm (10 in) of precipitation, recorded across 15 rainy days. In contrast, the driest month January brings less snow/rainfall, with 34 mm (1.3 in) over 11 snowy/rainy days. For more details, please visit our Gwangju Precipitation page.
The mean monthly precipitation over the year, including rain, hail, and snow
The average number of days each month with precipitation
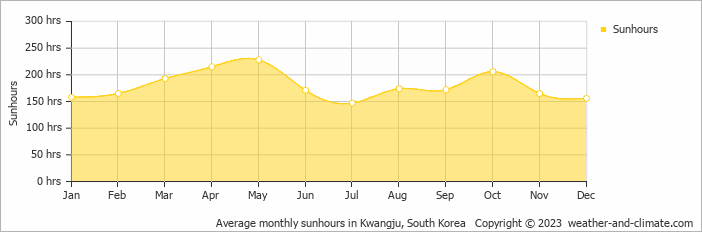
Sunshine Hours in Gwangju
While the amount of sunshine in Gwangju varies throughout the year, all seasons offer their own charm. Enjoy up to 7.6 hours of daily sun in May, and experience slightly darker atmosphere in July, with about 4.9 hours of daily sunlight.
Visit our detailed sunshine hours page for more information.
Monthly hours of sunshine
Daily hours of sunshine
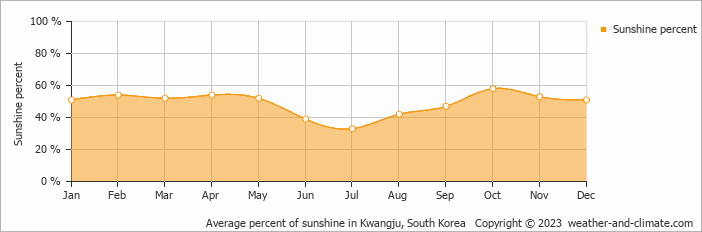
Daily percentage of sunshine
Humidity in Gwangju by Month
The relative humidity is high throughout the year in Gwangju.
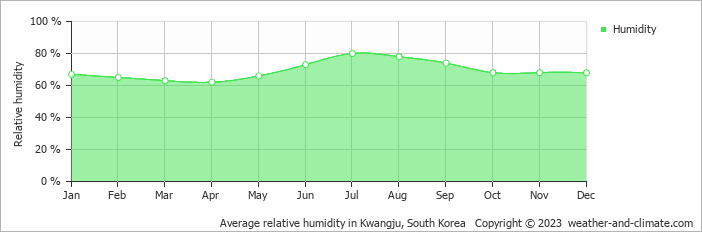
The city experiences its highest humidity in July, reaching 80%. In April, the humidity drops to its lowest level at 62%. What does this mean? Read our detailed page on humidity levels for further details.
Relative humidity over the year
Best Time to Visit Gwangju
The weather does bring rainfall during this period, between 57 mm (2.2 in) and 149 mm (5.9 in).
Plan accordingly for June, July and August, when conditions bring the heaviest precipitation. Seeking the perfect travel destination for this year? We've created a tool that suggests locations matching your desired weather. Let our weather planner guide your travel decisions.
Frequently asked questions about the climate in Gwangju
What is the best time to visit Gwangju?
April and October typically offer the most optimal weather in Gwangju. In contrast, January, February, July, August and December tend to have less optimal conditions. Gwangju has distinct dry (December to January) and wet (June to August) seasons.
What temperatures can I expect in Gwangju?
Daytime highs range from 6°C (43°F) in January to 31°C (88°F) in August. Nighttime lows range from -4°C (25°F) to 22°C (72°F). Temperatures vary considerably through the year.
How much rain does Gwangju get?
Annual rainfall is around 1298 mm (51 in). July is the wettest month with 256 mm (10 in), while January is the driest with 34 mm (1.3 in).
How sunny is Gwangju?
Gwangju receives around 2,150 hours of sunshine per year. May is the sunniest month with 228 hours, while July is the cloudiest with just 147 hours. Overall, Gwangju enjoys abundant sunshine.
Gwangju 3-Day Forecast
Gwangju 3-Day Forecast
Gwangju on the map
Gwangju is highlighted — select any city to see its climate.
Popular this month
Where to go in July — average daytime high across popular destinations.
Bucket list
Need travel inspiration? Check out our bucket list articles and be inspired.
