Gilgil Weather & Climate: Best Time to Visit
Average temperatures, rainfall, sunshine and the best time to visit Gilgil.
Climate overview of Gilgil
Gilgil, Hells Gate National Park, Kenya, has a stable climate with little temperature variation across the year. Average daytime temperatures hover around 23°C (73°F), peaking in February at 26°C (79°F) and dipping in July to 20°C (68°F).
The city receives considerable rainfall, with around 1245 mm (49 in) annually. April is the wettest month. January is the sunniest month, averaging 8.2 hours of sunshine per day.
Gilgil Weather by Month
Pick a month to see the average temperature, rainfall and sunshine in Gilgil - and find the best time to visit.
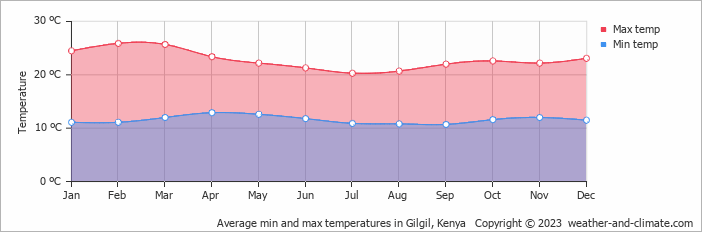
Monthly Temperature in Gilgil
With minimal seasonal shifts, Gilgil experiences a constant climate year-round. Typically, average maximum daytime temperatures range from a comfortable 26°C (79°F) in February to a pleasant 20°C (68°F) in the coolest month, July.
Nights vary from 13°C (55°F) in February to around 11°C (52°F) during the colder months.
Check out our detailed temperature page for more information.
Temperature ranges by month
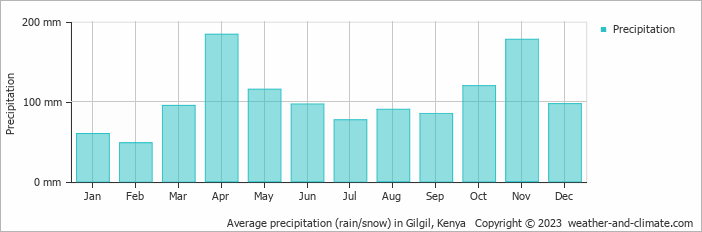
Rainfall in Gilgil
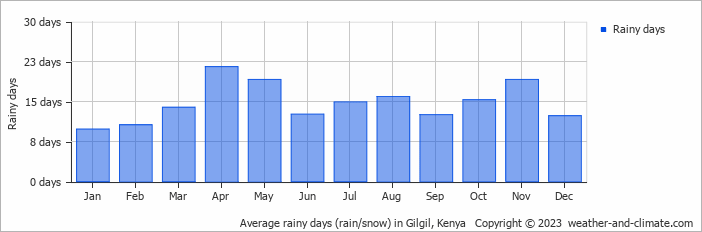
Gilgil has a notably wet climate with abundant precipitation, recording 1245 mm (49 in) of rainfall per year. The climate in Gilgil shows significant variation throughout the year. Expect heavy rainfall in April, the wettest month, with an average of 184 mm (7.2 in) of precipitation over 22 rainy days.
In contrast, the driest month February offers drier and sunnier days, with around 48 mm (1.9 in) of rainfall over 11 rainy days. For more details, please visit our Gilgil Precipitation page.
The mean monthly precipitation over the year, including rain, hail, and snow
The average number of days each month with precipitation
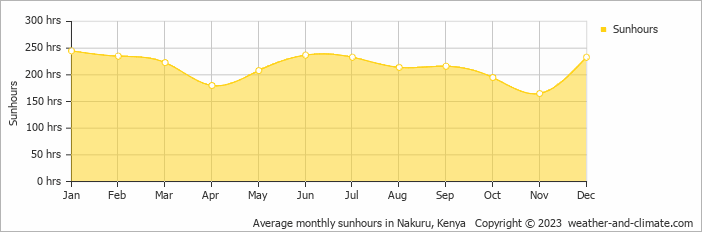
Sunshine Hours in Gilgil
Gilgil offers a pleasant mix of sunny and slightly overcast days. The difference in sunshine hours between January (8.2 hours daily) and November (5.5 hours daily) provides a bit of variety for visitors and residents.
Visit our detailed sunshine hours page for more information.
Monthly hours of sunshine
Daily hours of sunshine
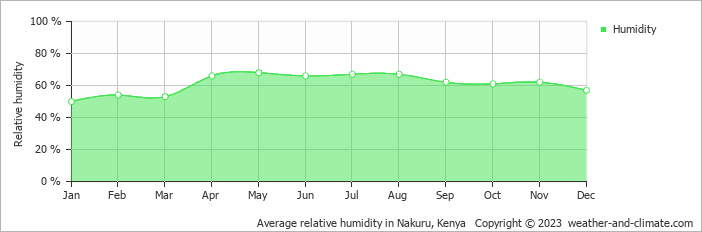
Humidity in Gilgil by Month
The relative humidity is high throughout the year in Gilgil.
The city experiences its highest humidity in May, reaching 68%. In January, the humidity drops to its lowest level at 50%. What does this mean? Read our detailed page on humidity levels for further details.
Relative humidity over the year
Best Time to Visit Gilgil
Monthly ratings reflect general weather comfort, based on daytime temperature and rainfall. Swimming and winter conditions are highlighted separately where relevant.
- Best overall: January, February, March, June, July, August, September and December
- Warmest weather: January, February and March
- Most sunshine: January, February, June, July and December
- Fewest rainy days: January and February
Frequently asked questions about the climate in Gilgil
What is the best time to visit Gilgil?
January, February, March, June, July, August, September and December typically offer the most optimal weather in Gilgil. In contrast, April tends to have less optimal conditions.
What temperatures can I expect in Gilgil?
Daytime highs range from 20°C (68°F) in July to 26°C (79°F) in February. Nighttime lows range from 11°C (52°F) to 13°C (55°F). Temperatures stay relatively stable year-round.
How much rain does Gilgil get?
Annual rainfall is around 1245 mm (49 in). April is the wettest month with 184 mm (7.2 in), while February is the driest with 48 mm (1.9 in).
How sunny is Gilgil?
Gilgil receives around 2,584 hours of sunshine per year. January is the sunniest month with 245 hours, while November is the cloudiest with just 165 hours. Overall, Gilgil enjoys abundant sunshine.
Gilgil 3-Day Forecast
Gilgil 3-Day Forecast
Gilgil on the map
Gilgil is highlighted - select any city to see its climate.
Popular this month
Where to go in July - average daytime high across popular destinations.
Bucket list
Need travel inspiration? Check out our bucket list articles and be inspired.
 The 10 best wildlife viewing sites in Kenya
Explore Kenya's top 10 safari parks in this guide, featuring the Maasai Mara, Amboseli, and more, for a spectacular wildlife adventure
Not on the map - Yoga Teacher Training in Kenya
A yoga training with the rawness of mother Africa. In a place so untouched we really are walking on the same earth elephants roamed not so long ago.
Tsavo National Park in Kenia
From mid-July to September and December to mid-March are the best months to visit both Tsavo National Parks. This park is a must see. The park is mountainous and green.