Gangtok Weather & Climate: Best Time to Visit
Average temperatures, rainfall, sunshine and the best time to visit Gangtok.
Climate overview of Gangtok
Gangtok, Sikkim, India, experiences significant temperature variation throughout the year. Summers bring daytime highs of 22°C (72°F) in August, while winters cool to 11°C (52°F) in January.
With around 5153 mm (203 in) of annual rain/snowfall, Gangtok has a notably wet climate. However, this rain/snowfall is not evenly distributed, the city has warm summers and cold winters. The wettest month is July.
Gangtok Weather by Month
Pick a month to see the average temperature, rainfall and sunshine in Gangtok - and find the best time to visit.
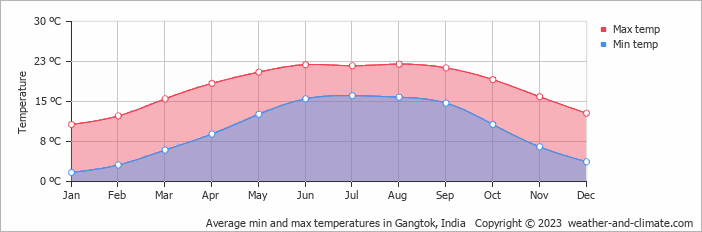
Monthly Temperature in Gangtok
Depending on the time of the year, temperatures range from comfortable to chilly in Gangtok. Average daytime temperatures reach a comfortable 22°C (72°F) in August. In January, the coolest month of the year, temperatures drop to a chilly 11°C (52°F).
At night, temperatures range from around 16°C (61°F) in August to 2°C (36°F) in January.
Check out our detailed temperature page for more information.
Temperature ranges by month
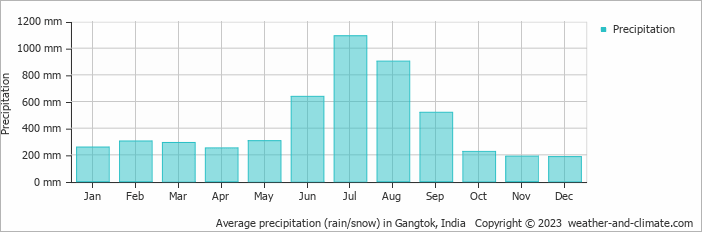
Rainfall in Gangtok
Gangtok has a relatively rain/snowy climate with high precipitation levels, averaging 5153 mm (203 in) of rain/snowfall annually. Gangtok can be quite wet during July, receiving approximately 1092 mm (43 in) of precipitation over 19 rainy days.
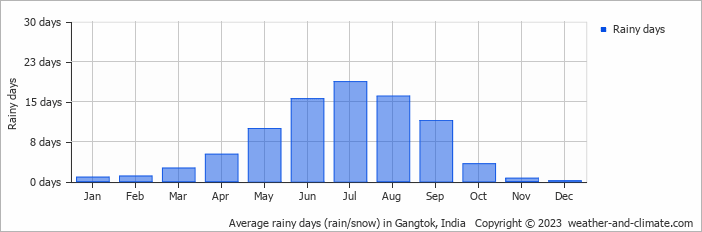
In contrast, during the driest month (December), you will experience much drier conditions, with 186 mm (7.3 in) of precipitation spread across 0 rainy days. For more details, please visit our Gangtok Precipitation page.
The mean monthly precipitation over the year, including rain, hail, and snow
The average number of days each month with precipitation
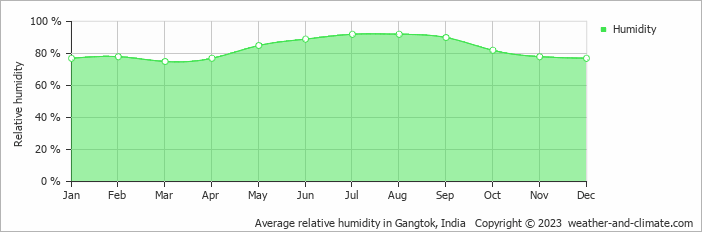
Humidity in Gangtok by Month
The city experiences its highest humidity in July, reaching 92%. In March, the humidity drops to its lowest level at 75%. What does this mean? Read our detailed page on humidity levels for further details.
Relative humidity over the year
Best Time to Visit Gangtok
Monthly ratings reflect general weather comfort, based on daytime temperature and rainfall. Swimming and winter conditions are highlighted separately where relevant.
- Warmest weather: May, June, July, August and September
- Fewest rainy days: January, February, November and December
- Wettest months: June, July, August and September, when rainfall is highest.
- Seasonal pattern: Warm summers and cold winters
Frequently asked questions about the climate in Gangtok
What is the best time to visit Gangtok?
Gangtok has warm summers and cold winters.
What temperatures can I expect in Gangtok?
Daytime highs range from 11°C (52°F) in January to 22°C (72°F) in August. Nighttime lows range from 2°C (36°F) to 16°C (61°F). Temperatures vary considerably through the year.
How much rain does Gangtok get?
Annual rainfall is around 5153 mm (203 in). July is the wettest month with 1092 mm (43 in), while December is the driest with 186 mm (7.3 in).
Gangtok 3-Day Forecast
Gangtok on the map
Gangtok is highlighted - select any city to see its climate.
Popular this month
Where to go in July - average daytime high across popular destinations.
Bucket list
Need travel inspiration? Check out our bucket list articles and be inspired.
 A paradise called Andaman Islands
Though officially Indian, the Andamans are nearer Myanmar, Indonesia, and Thailand, resulting in amazing, budget-friendly white-sand beaches.
The 5 most beautiful monasteries in Ladakh
Explore Ladakh's spiritual essence through its incredible Buddhist monasteries. See architectural wonders, rich traditions, and serene landscapes in this guide.
Sleeping under the stars and riding camels in Rajasthan
A desert safari in Jaisalmer is definitely one of the highlights during a visit to India. Spending a night in the desert is a great adventurous bucket list experience.
Avoid mass tourism on an eco boat in the backwaters of Kerala
We can tell you now how you can avoid being surrounded by tourists and at the same time minimize your impact on the environment.