Espinama Weather and Climate: A Comprehensive Guide
The temperature in Espinama can vary greatly throughout the year.
The temperatures shift from pleasant
to cold.
It also has a notably wet climate with much precipitation.
Let’s explore the climate details in depth to provide you with a complete overview.
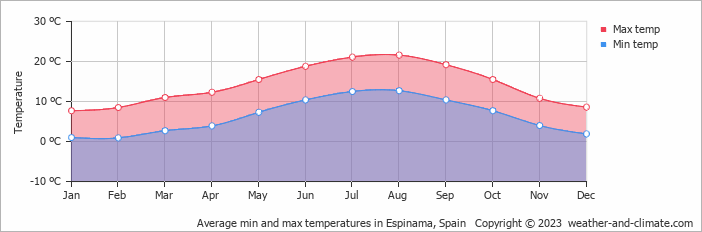
Average maximum day and minimum night temperature
Depending on the time of the year, temperatures range from pleasant to chilly in Espinama. Average maximum daytime temperatures range from a pleasant 22°C in August, the warmest time of the year, to a chilly 8°C during cooler months like February.
At night, temperatures typically drop to an average of around 1°C during these months.Check out our detailed temperature page for more information.
Temperature ranges by month
Precipitation and rainy days
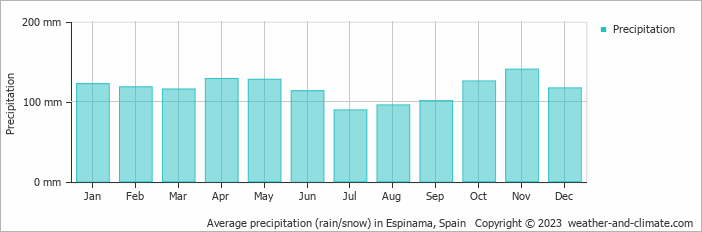
Espinama has a relatively rain/snowy climate with high precipitation levels, averaging 1393 mm of rain/snowfall annually. Year-round, Espinama has a balanced climate with minimal variation in precipitation. The difference between the wettest month, November, with 140 mm, and the driest month, July, with 89 mm, is minimal.
The mean monthly precipitation over the year, including rain, hail and snow
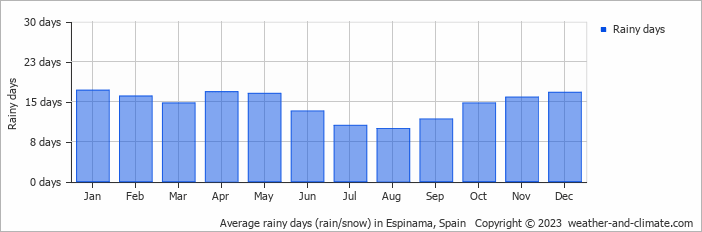
The average number of days each month with precipitation
overcast and heavy snow partly cloudy and no rain broken clouds and chance of snowForecast for Espinama
 5 m/s
5 m/s![]() 1 m/s
1 m/s![]() 2 m/s
2 m/s![]()
Select a Month of Interest
Check the conditions for any month of the year.
The best time of year to visit Espinama in Spain
During the months of July and August you are most likely to experience good weather with pleasant average temperatures that fall between 20°C and 26°C.Other facts from our historical weather data:
August has an average maximum temperature of 22°C and is the warmest month of the year.
The coldest month is February with an average maximum temperature of 8°C.
November tops the wettest month list with 140 mm of rainfall.
July is the driest month with 89 mm of precipitation.
No idea where to travel to this year? We have a tool that recommends destinations based on your ideal conditions. Find out where to go with our weather planner.


