














 Warm Sea Without Extreme Heat: 8 Beach Destinations With Comfortable Weather
Love warm seawater but not extreme heat? Compare eight beach destinations where the sea stays warm while daytime temperatures remain comfortable.
Average temperatures, rainfall, sunshine and the best time to visit El Pescadero.
 –
10-day forecastForecast
–
10-day forecastForecast
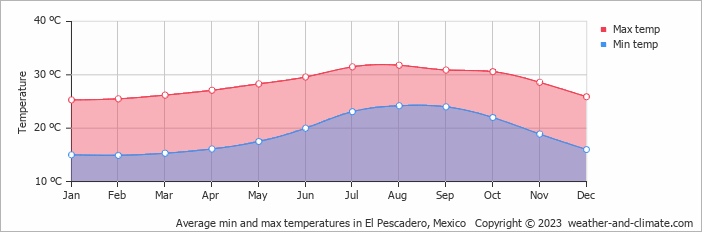
The climate in El Pescadero, Baja California Sur, Mexico, is remarkably consistent, with temperatures year-round averaging 28°C (82°F). The warmest month is August at 32°C (90°F), and the coolest is January at 25°C (77°F).
The city has a relatively dry climate, receiving around 347 mm (14 in) of rainfall per year. It does experience a distinct dry season from October to July. September is the wettest month and May the driest.
Pick a month to see the average temperature, rainfall and sunshine in El Pescadero - and find the best time to visit.
In El Pescadero temperatures are generally consistent throughout the year. On average, daytime temperatures range from a very warm 32°C (90°F) in August to a comfortable 25°C (77°F) in January.
Nighttime temperatures range from 24°C (75°F) in August to 15°C (59°F) in January.
Check out our detailed temperature page for more information.
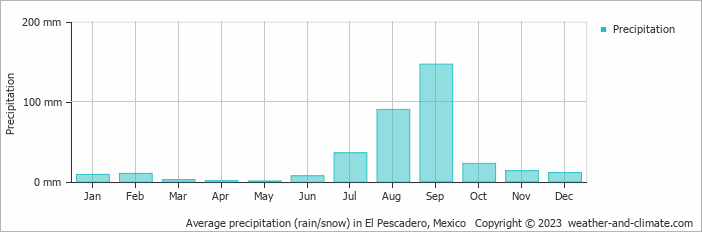
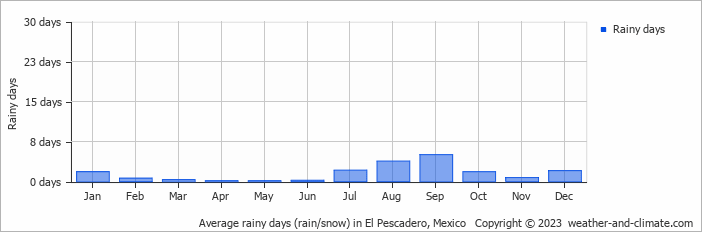
El Pescadero tends toward drier weather patterns, receiving approximately 347 mm (14 in) of rain per year. The seasons in El Pescadero bring significant changes in precipitation. The wettest month, September, receives high rainfall, with an average of 146 mm (5.7 in) of precipitation. This rainfall is distributed across 5 rainy days.
In contrast, the driest month, May, experiences much less rainfall, totaling 0.5 mm (0.02 in) over 0 rainy days. These distinct seasonal differences provide diverse experiences throughout the year. For more details, please visit our El Pescadero Precipitation page.
Monthly ratings reflect general weather comfort, based on daytime temperature and rainfall. Swimming and winter conditions are highlighted separately where relevant.
January, February, March, April, May, November and December typically offer the most optimal weather in El Pescadero. In contrast, September tends to have less optimal conditions. El Pescadero has a distinct dry season from October to July.
Daytime highs range from 25°C (77°F) in January to 32°C (90°F) in August. Nighttime lows range from 15°C (59°F) to 24°C (75°F). Temperatures stay relatively stable year-round.
Annual rainfall is around 347 mm (14 in). September is the wettest month with 146 mm (5.7 in), while May is the driest with 0.5 mm (0.02 in).
El Pescadero is highlighted - select any city to see its climate.
Where to go in October - average daytime high across popular destinations.
 Los Cabos32°C (90°F) Puerto Peñasco30°C (86°F) Tulum
 30°C (86°F) Puerto Vallarta29°C (84°F) Cancún30°C (86°F) Playa del Carmen30°C (86°F) Mexico City
 22°C (72°F)
 Need travel inspiration? Check out our bucket list articles and be inspired.
Warm Sea Without Extreme Heat: 8 Beach Destinations With Comfortable Weather
Love warm seawater but not extreme heat? Compare eight beach destinations where the sea stays warm while daytime temperatures remain comfortable.

 Best Spring Break Destinations for Great Weather and Fewer Crowds
Skip crowded spring break resorts. Compare March weather and travel style in Puerto Escondido, San Juan del Sur, Roatán, Caye Caulker and Curaçao.

 Warm Days, Cool Nights: 8 Destinations With the Perfect Day-Night Temperature
Prefer warm sunny days but cool evenings? Compare eight destinations with daytime temperatures of around 25–30°C, cooler nights, low rainfall and plenty of sunshine.
 Where to Travel in July and August: Mexico, Thailand, Indonesia or Somewhere Else?
Compare July and August weather in Mexico, Thailand, Indonesia, Zanzibar and Sri Lanka, using historical climate data for temperature, rainfall and sunshine.