














 Visit the Rainbow Mountains
The Rainbow Mountain (Vinicunca) is acolored rainbow mountain that will steal your heart forever and the view from the top will take your breath away.
Average temperatures, rainfall, sunshine and the best time to visit El Ñuro.
 –
–
El Ñuro in Peru is where tourists come to swim with sea turtles and is often visited from nearby Los Órganos. The weather here is characterized by steady average temperatures throughout the year and fairly dry conditions year-round. Let’s now guide you through the climate details for a complete overview.
Pick a month to see the average temperature, rainfall and sunshine in El Ñuro - and find the best time to visit.
The climate in El Ñuro remains fairly constant, offering comfortable temperatures throughout the year. Average maximum daytime temperatures range from a comfortable 28°C (82°F) in March, the warmest time of the year, to a comfortable 24°C (75°F) during cooler months like August.
At night, you can expect temperatures ranging from 24°C (75°F) in March to around 19°C (66°F) during August.
Check out our detailed temperature page for more information.

El Ñuro typically sees modest rainfall throughout the year, with an average annual precipitation of 252 mm (9.9 in). Significant seasonal changes in precipitation occur throughout the year. In the wettest month, February it receives moderate rainfall, averaging 74 mm (2.9 in) of precipitation, recorded across 6 rainy days. In contrast, the driest month August brings less rainfall, with 0.9 mm (0.04 in) over a single rainy day. For more details, please visit our El Ñuro Precipitation page.


Monthly ratings reflect general weather comfort, based on daytime temperature and rainfall. Swimming and winter conditions are highlighted separately where relevant.
El Ñuro has a distinct dry season from April to January.
Daytime highs range from 24°C (75°F) in August to 28°C (82°F) in March. Nighttime lows range from 19°C (66°F) to 24°C (75°F). Temperatures stay relatively stable year-round.
Annual rainfall is around 252 mm (9.9 in). February is the wettest month with 74 mm (2.9 in), while August is the driest with 0.9 mm (0.04 in).
El Ñuro is highlighted - select any city to see its climate.
Where to go in October - average daytime high across popular destinations.
Iquitos 32°C (90°F) Trujillo22°C (72°F) Lima20°C (68°F) Arequipa
 20°C (68°F) Puno17°C (63°F) Cusco
 17°C (63°F) Machu Picchu16°C (61°F) Urubamba
 14°C (57°F)
 Need travel inspiration? Check out our bucket list articles and be inspired.
Visit the Rainbow Mountains
The Rainbow Mountain (Vinicunca) is acolored rainbow mountain that will steal your heart forever and the view from the top will take your breath away.
 "The other" Machu Picchu: the Inca City of Choquequirao
Discover Choquequirao, the hidden Inca city near Cusco. Hike through stunning landscapes and explore ancient ruins with fewer crowds than Machu Picchu.
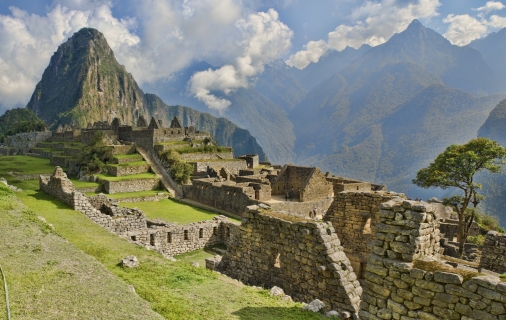 Hike the inca Trail
Few walking tours speak so much to the imagination as the Inca Trail to Machu Picchu. The tour leads through beautiful mountain landscapes and it is called the 'Royal Highway'
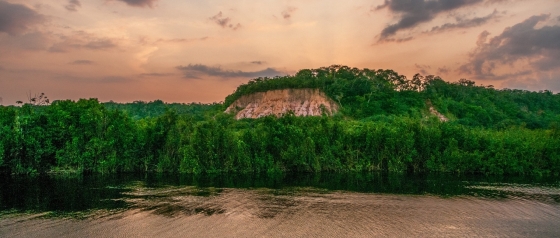 The Inkaterra Reserva Amazonica
One of your highlights during a trip in Peru might be this eco-luxury lodge in front of the Madre de Dios River, called Inkaterra Reserva Amazonica.