Chicanna Weather & Climate: Best Time to Visit
Average temperatures, rainfall, sunshine and the best time to visit Chicanna.
Climate overview of Chicanna
Chicanna, Campeche, Mexico, has a stable climate with little temperature variation across the year. Average daytime temperatures hover around 33°C (91°F), peaking in April at 36°C (97°F) and dipping in January to 30°C (86°F).
The city receives around 877 mm (35 in) of rainfall per year. It experiences a distinct dry season from December to April. September is the wettest month and February the driest.
Chicanna Weather by Month
Pick a month to see the average temperature, rainfall and sunshine in Chicanna — and find the best time to visit.
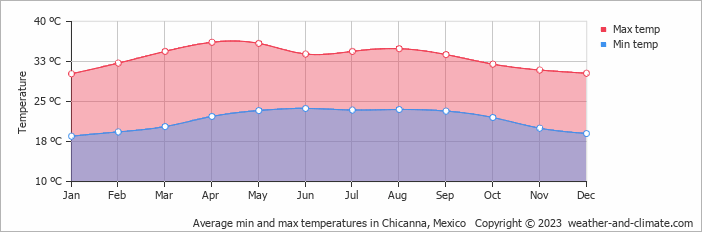
Monthly Temperature in Chicanna
With minimal seasonal shifts, Chicanna experiences a constant climate year-round. On average, daytime temperatures range from a very hot 36°C (97°F) in April to a very warm 30°C (86°F) in January.
Nighttime temperatures range from 24°C (75°F) in April to 19°C (66°F) in January.
Check out our detailed temperature page for more information.
Temperature ranges by month
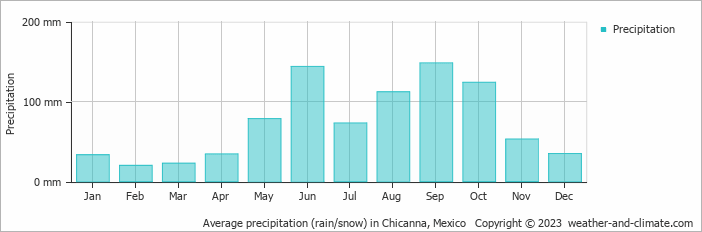
Rainfall in Chicanna
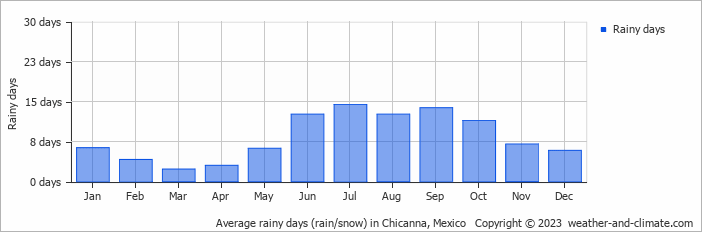
Generally, Chicanna receives mid-range precipitation levels, with 877 mm (35 in) annually. The seasons in Chicanna bring significant changes in precipitation. The wettest month, September, receives high rainfall, with an average of 148 mm (5.8 in) of precipitation. This rainfall is distributed across 14 rainy days.
In contrast, the driest month, February, experiences much less rainfall, totaling 20 mm (0.8 in) over 4 rainy days. These distinct seasonal differences provide diverse experiences throughout the year. For more details, please visit our Chicanna Precipitation page.
The mean monthly precipitation over the year, including rain, hail, and snow
The average number of days each month with precipitation
Best Time to Visit Chicanna
It's smart to plan your activities during the cooler morning hours or take advantage of the refreshing evenings. Seeking the perfect travel destination for this year? We've created a tool that suggests locations matching your desired weather. Let our weather planner guide your travel decisions.
Frequently asked questions about the climate in Chicanna
What is the best time to visit Chicanna?
February typically offers the most optimal weather in Chicanna. In contrast, March, April, May, June, July, August and September tend to have less optimal conditions. Chicanna has a distinct dry season from December to April.
What temperatures can I expect in Chicanna?
Daytime highs range from 30°C (86°F) in January to 36°C (97°F) in April. Nighttime lows range from 19°C (66°F) to 24°C (75°F). Temperatures stay relatively stable year-round.
How much rain does Chicanna get?
Annual rainfall is around 877 mm (35 in). September is the wettest month with 148 mm (5.8 in), while February is the driest with 20 mm (0.8 in).
Chicanna 3-Day Forecast
Chicanna 3-Day Forecast
Chicanna on the map
Chicanna is highlighted — select any city to see its climate.
Popular this month
Where to go in July — average daytime high across popular destinations.
Bucket list
Need travel inspiration? Check out our bucket list articles and be inspired.
 Explore the Majestic Copper Canyons of Mexico
Explore the vast Copper Canyons in Chihuahua, Mexico—larger than the Grand Canyon. Discover scenic train rides, hikes, and the Tarahumara people.
These are the most beautiful Mayan ruins and Mayan temples in Mexico
Mexico is a destination where you can immerse yourself in ancient cultures and civilizations. In this article we have listed our favorite Mayan ruins.
Tips, to-do's and nicest restaurants in Mexico City
Mexico City, one of the most famous and notorious cities of the world. The best time to visit is between March and May, but it can be visited year round.
Zihuatanejo: A Pacific paradise with beautiful beaches
Zihuatanejo has some of Mexico's top beaches. Unlike other off-the-beaten-path destinations in Mexico, Zihua is very accessible and sustainable.