Changning, China - Weather and Climate
The temperature in Changning, China can vary quite a bit throughout the year.
Temperatures can be very warm during the warmest months,
and cold during the cooler months.
It also has a notably wet climate with much precipitation.
Let's now guide you through the climate details for a complete overview.
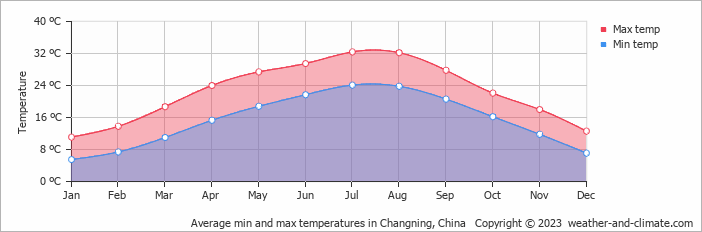
Average maximum day and minimum night temperature
Visitors to Changning can expect significant temperature changes throughout the year. Average maximum daytime temperatures range from a very warm 32°C in July, the warmest time of the year, to a chilly 11°C during cooler months like January.
At night, temperatures typically drop to an average of around 6°C during these months.Check out our detailed temperature page for more information.
Temperature ranges by month
Precipitation and rainy days
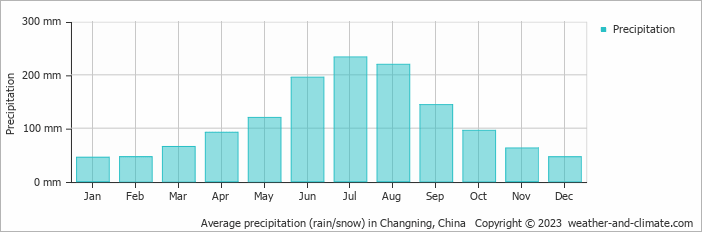
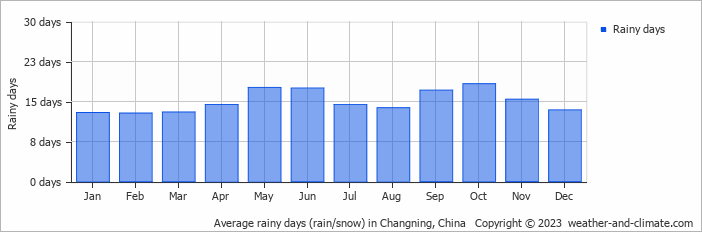
Changning is known for its substantial rainfall, with annual precipitation reaching 1365 mm. Significant seasonal changes in precipitation occur throughout the year. During the wetter season, July receives heavy rainfall, averaging 233 mm of precipitation, recorded across 14 rainy days. In contrast, the drier season, January brings less rainfall, with 45 mm over 13 rainy days. For more details, please visit our Changning Precipitation page.
The mean monthly precipitation over the year, including rain, hail and snow
The average number of days each month with precipitation
Forecast for Changning


Select a Month of Interest
Check the conditions for any month of the year.
The best time of year to visit Changning in China
During the months of April and October you are most likely to experience good weather with pleasant average temperatures that fall between 20°C and 26°C.Other facts from our historical weather data:
Most rainfall (rainy season) is seen in June, July and August.
July has an average maximum temperature of 32°C and is the warmest month of the year.
The coldest month is January with an average maximum temperature of 11°C.
July tops the wettest month list with 233 mm of rainfall.
January is the driest month with 45 mm of precipitation.
No idea where to travel to this year? We have a tool that recommends destinations based on your ideal conditions. Find out where to go with our weather planner.


