















 The 10 most alternative cities in South America
Discover South America's top 10 alternative cities! From Valparaíso's vibrant streets to La Paz's high-altitude charm and Medellín's innovative spirit.
Average temperatures, rainfall, sunshine and the best time to visit Capilla del Señor.
 –
10-day forecastForecast
–
10-day forecastForecast
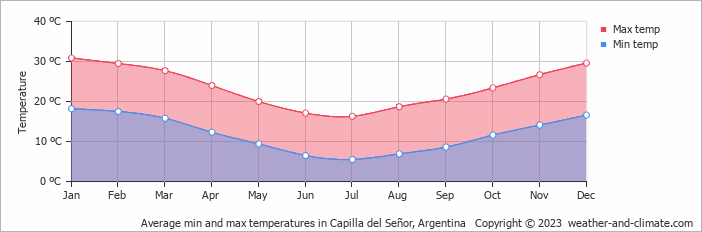
Temperatures in Capilla del Señor, Buenos Aires Province, Argentina, vary greatly throughout the year. January is the hottest month at 31°C (88°F), while July is the coldest at 16°C (61°F).
The city receives considerable rainfall, with around 1075 mm (42 in) annually. October is the wettest month. It has very warm summers and mild winters.
Pick a month to see the average temperature, rainfall and sunshine in Capilla del Señor - and find the best time to visit.
The climate in Capilla del Señor is known for significant temperature differences throughout the year, making the weather dynamic. Typically, average maximum daytime temperatures range from a very warm 31°C (88°F) in January to a moderate 16°C (61°F) in the coolest month, July.
Nights vary from 18°C (64°F) in January to around 6°C (43°F) during the colder months.
Check out our detailed temperature page for more information.
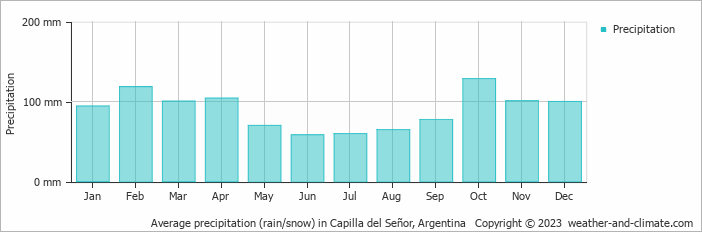
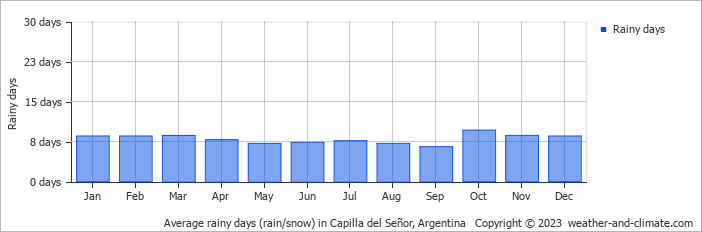
Capilla del Señor has a notably wet climate with abundant precipitation, recording 1075 mm (42 in) of rainfall per year. The climate in Capilla del Señor shows significant variation throughout the year. Expect high rainfall in October, the wettest month, with an average of 128 mm (5 in) of precipitation over 10 rainy days.
In contrast, the driest month June offers drier and sunnier days, with around 58 mm (2.3 in) of rainfall over 7 rainy days. For more details, please visit our Capilla del Señor Precipitation page.
Monthly ratings reflect general weather comfort, based on daytime temperature and rainfall. Swimming and winter conditions are highlighted separately where relevant.
May and September typically offer the most optimal weather in Capilla del Señor. In contrast, February and December tend to have less optimal conditions. Capilla del Señor has very warm summers and mild winters.
Daytime highs range from 16°C (61°F) in July to 31°C (88°F) in January. Nighttime lows range from 6°C (43°F) to 18°C (64°F). Temperatures vary considerably through the year.
Annual rainfall is around 1075 mm (42 in). October is the wettest month with 128 mm (5 in), while June is the driest with 58 mm (2.3 in).
Capilla del Señor is highlighted - select any city to see its climate.
Where to go in October - average daytime high across popular destinations.
Córdoba 25°C (77°F) Mendoza
 24°C (75°F) Salta
 23°C (73°F) Villa Carlos Paz23°C (73°F) Buenos Aires23°C (73°F) Mar del Plata18°C (64°F) San Carlos de Bariloche11°C (52°F) San Martín de los Andes11°C (52°F)
 Need travel inspiration? Check out our bucket list articles and be inspired.
The 10 most alternative cities in South America
Discover South America's top 10 alternative cities! From Valparaíso's vibrant streets to La Paz's high-altitude charm and Medellín's innovative spirit.
 Warm Days, Cool Nights: 8 Destinations With the Perfect Day-Night Temperature
Prefer warm sunny days but cool evenings? Compare eight destinations with daytime temperatures of around 25–30°C, cooler nights, low rainfall and plenty of sunshine.
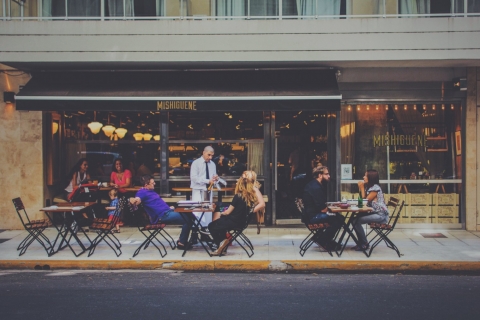 Be amazed by Buenos Aires
The city of beautiful museums, cute streets, green parks, lots of good food, interesting local neighborhoods and impressive historical buildings.
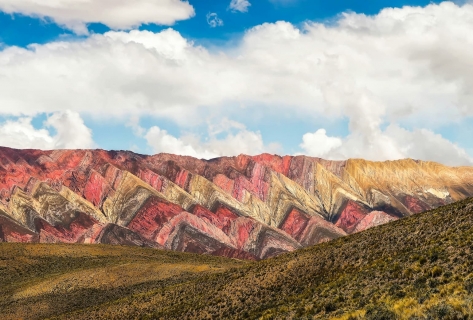 Argentina in November: Where to Go for the Best Weather
Compare November weather in Mendoza, Buenos Aires, Cafayate, Bariloche and Ushuaia to find Argentina's warmest, sunniest and driest places.