Caçapava Weather & Climate: Best Time to Visit
Average temperatures, rainfall, sunshine and the best time to visit Caçapava.
Climate overview of Caçapava
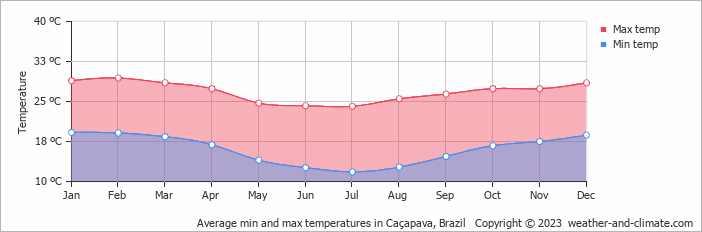
With consistently stable weather, Caçapava, Brazil, sees little seasonal temperature change. Daytime highs average 27°C (81°F), ranging from 29°C (84°F) in February to 24°C (75°F) in July.
Rainfall is high, totalling around 1534 mm (60 in) per year. January is the wettest month and August the driest. The city also experiences a distinct rainy season from November to March. The most sunshine falls in July, with an average of 6.0 hours of daily sunshine.
Caçapava Weather by Month
Pick a month to see the average temperature, rainfall and sunshine in Caçapava — and find the best time to visit.
Monthly Temperature in Caçapava
The climate in Caçapava remains fairly constant, offering comfortable temperatures throughout the year. Average maximum daytime temperatures range from a comfortable 29°C (84°F) in February, the warmest time of the year, to a comfortable 24°C (75°F) during cooler months like July.
At night, you can expect temperatures ranging from 19°C (66°F) in February to around 12°C (54°F) during July.
Check out our detailed temperature page for more information.
Temperature ranges by month
Rainfall in Caçapava
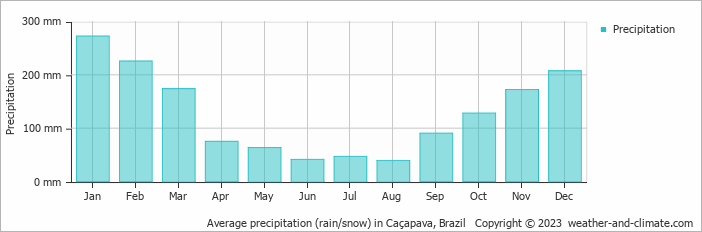
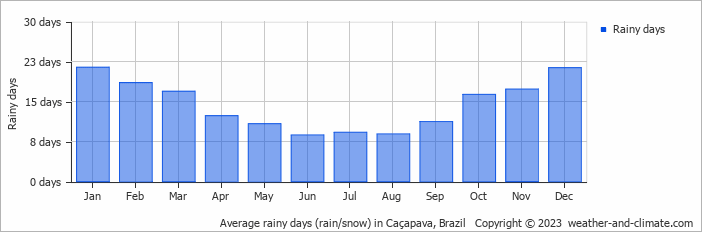
Caçapava is known for its substantial rainfall, with annual precipitation reaching 1534 mm (60 in). Significant seasonal changes in precipitation occur throughout the year. In the wettest month, January it receives heavy rainfall, averaging 272 mm (11 in) of precipitation, recorded across 21 rainy days. In contrast, the driest month August brings less rainfall, with 39 mm (1.5 in) over 9 rainy days. For more details, please visit our Caçapava Precipitation page.
The mean monthly precipitation over the year, including rain, hail, and snow
The average number of days each month with precipitation
Sunshine Hours in Caçapava
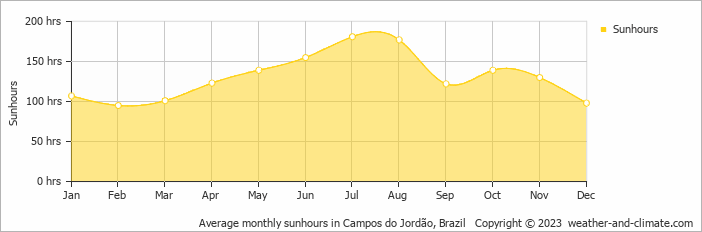
Seasonal changes in sunshine hours are quite dramatic in Caçapava. While July receives considerable daily sunshine with up to 6.0 hours, February marks the darkest time of the year, where sunshine is scarce with only 3.2 hours of sunlight per day.
Visit our detailed sunshine hours page for more information.
Monthly hours of sunshine
Daily hours of sunshine
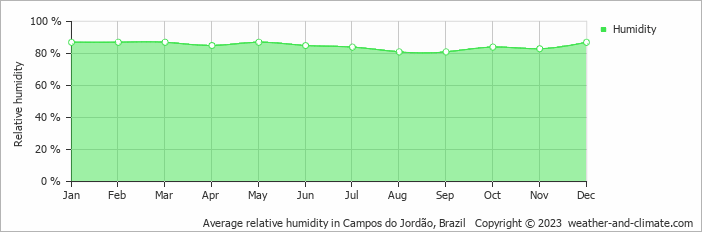
Humidity in Caçapava by Month
The city experiences its highest humidity in January, reaching 87%. In August, the humidity drops to its lowest level at 81%. What does this mean? Read our detailed page on humidity levels for further details.
Relative humidity over the year
Best Time to Visit Caçapava
The weather does bring rainfall during this period, between 39 mm (1.5 in) and 128 mm (5 in).
Plan accordingly for January, February, March, November and December, when conditions bring the heaviest precipitation. Seeking the perfect travel destination for this year? We've created a tool that suggests locations matching your desired weather. Let our weather planner guide your travel decisions.
Frequently asked questions about the climate in Caçapava
What is the best time to visit Caçapava?
April, May, June, July, August and September typically offer the most optimal weather in Caçapava. In contrast, January tends to have less optimal conditions. Caçapava has a distinct rainy season from November to March.
What temperatures can I expect in Caçapava?
Daytime highs range from 24°C (75°F) in July to 29°C (84°F) in February. Nighttime lows range from 12°C (54°F) to 19°C (66°F). Temperatures stay relatively stable year-round.
How much rain does Caçapava get?
Annual rainfall is around 1534 mm (60 in). January is the wettest month with 272 mm (11 in), while August is the driest with 39 mm (1.5 in).
How sunny is Caçapava?
Caçapava receives around 1,567 hours of sunshine per year. July is the sunniest month with 181 hours, while February is the cloudiest with just 95 hours.
Caçapava 3-Day Forecast
Caçapava 3-Day Forecast
Caçapava on the map
Caçapava is highlighted — select any city to see its climate.
Popular this month
Where to go in June — average daytime high across popular destinations.
Bucket list
Need travel inspiration? Check out our bucket list articles and be inspired.
 The 10 most alternative cities in South America
Discover South America's top 10 alternative cities! From Valparaíso's vibrant streets to La Paz's high-altitude charm and Medellín's innovative spirit.
 The 5 most tranquil retreats in the Amazon Rainforest, Brazil
Discover top sustainable lodges in the Amazon. Enjoy unique wildlife, eco-friendly stays, and immersive experiences at Anavilhanas, Cristalino, and more.
An alternative way to discover Rio de Janeiro
Don't feel like seeing the traditional tourist sights in Rio de Janeiro? We have made an overview of the sights in Rio de Janeiro that you must see if you want to visit Rio in an alternative way.
Iguazu Falls
Iguazu Falls are among the largest waterfalls on earth. You will be speechless when you see this miracle of mother nature. They are included in the World Heritage List and have also been named one of the seven wonders of the world.