

















 The 10 most alternative cities in South America
Discover South America's top 10 alternative cities! From Valparaíso's vibrant streets to La Paz's high-altitude charm and Medellín's innovative spirit.
Average temperatures, rainfall, sunshine and the best time to visit Cabo Polonio.
 –
–
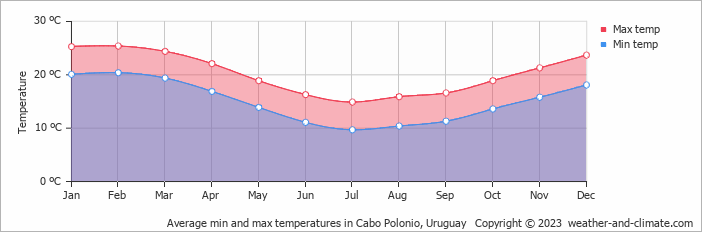
Temperatures in Cabo Polonio, Rocha, Uruguay, shift moderately through the seasons. The warmest month is February at 25°C (77°F), and the coolest is July at 15°C (59°F).
Rainfall is high, totalling around 1250 mm (49 in) per year. April is the wettest month and January the driest. The city also experiences warm summers and mild winters. The most sunshine falls in January, with an average of 9.0 hours of daily sunshine.
Pick a month to see the average temperature, rainfall and sunshine in Cabo Polonio - and find the best time to visit.
In Cabo Polonio, seasonal changes bring about a moderate variation in temperatures. Average maximum daytime temperatures range from a comfortable 25°C (77°F) in February, the warmest time of the year, to a moderate 15°C (59°F) during cooler months like July.
At night, you can expect temperatures ranging from 20°C (68°F) in February to around 10°C (50°F) during July.
Check out our detailed temperature page for more information.
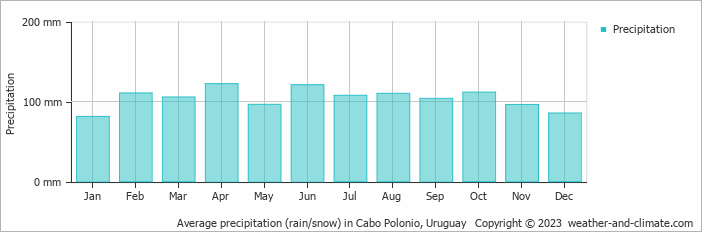
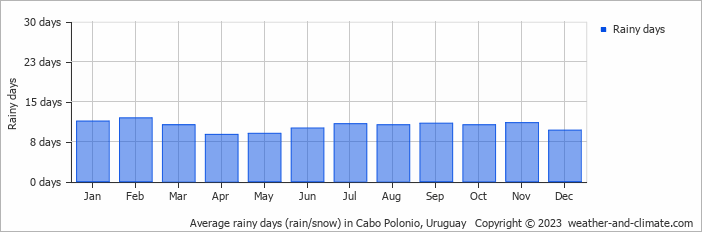
Cabo Polonio has a notably wet climate with abundant precipitation, recording 1250 mm (49 in) of rainfall per year. Year-round, Cabo Polonio has a balanced climate with minimal variation in precipitation. The difference between the wettest month, April, with 122 mm (4.8 in), and the driest month, January, with 81 mm (3.2 in), is minimal. For more details, please visit our Cabo Polonio Precipitation page.
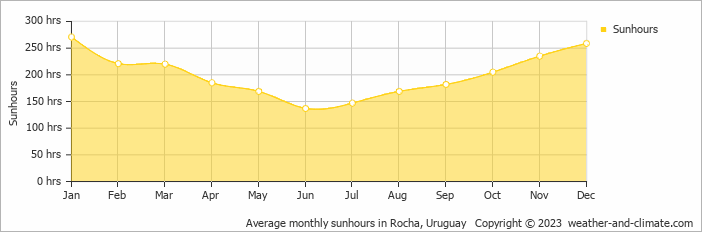
Seasonal changes in sunshine hours are quite dramatic in Cabo Polonio. While January receives considerable daily sunshine with up to 9.0 hours, June marks the darkest time of the year, where sunshine is scarce with only 4.6 hours of sunlight per day.
Visit our detailed sunshine hours page for more information.
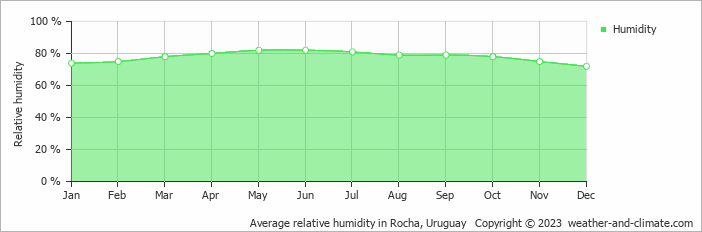
The relative humidity is high throughout the year in Cabo Polonio.
The city experiences its highest humidity in May, reaching 82%. In December, the humidity drops to its lowest level at 72%. What does this mean? Read our detailed page on humidity levels for further details.
Monthly ratings reflect general weather comfort, based on daytime temperature and rainfall. Swimming and winter conditions are highlighted separately where relevant.
January, November and December typically offer the most optimal weather in Cabo Polonio. In contrast, June, July, August and September tend to have less optimal conditions. Cabo Polonio has warm summers and mild winters.
Daytime highs range from 15°C (59°F) in July to 25°C (77°F) in February. Nighttime lows range from 10°C (50°F) to 20°C (68°F).
Annual rainfall is around 1250 mm (49 in). April is the wettest month with 122 mm (4.8 in), while January is the driest with 81 mm (3.2 in).
Cabo Polonio receives around 2,400 hours of sunshine per year. January is the sunniest month with 271 hours, while June is the cloudiest with just 137 hours. Overall, Cabo Polonio enjoys abundant sunshine.
Cabo Polonio is highlighted - select any city to see its climate.
Where to go in October - average daytime high across popular destinations.
 Colonia del Sacramento
 21°C (70°F) Montevideo20°C (68°F) La Pedrera19°C (66°F) José Ignacio19°C (66°F) Piriápolis19°C (66°F) La Paloma19°C (66°F) Punta Del Diablo19°C (66°F) Punta del Este18°C (64°F)
 Need travel inspiration? Check out our bucket list articles and be inspired.
The 10 most alternative cities in South America
Discover South America's top 10 alternative cities! From Valparaíso's vibrant streets to La Paz's high-altitude charm and Medellín's innovative spirit.
 Carmelo is the best kept secret of Uruguay
With its natural beauty and history, Carmelo is an inviting place to visit. Enjoy nature, tranquility, authenticity, the 'wine' and activities such as cycling, walking and horse riding.

 Visit the Rainbow Mountains
The Rainbow Mountain (Vinicunca) is acolored rainbow mountain that will steal your heart forever and the view from the top will take your breath away.

 The 5 most tranquil retreats in the Amazon Rainforest, Brazil
Discover top sustainable lodges in the Amazon. Enjoy unique wildlife, eco-friendly stays, and immersive experiences at Anavilhanas, Cristalino, and more.