Zarqa Weather & Climate: Best Time to Visit
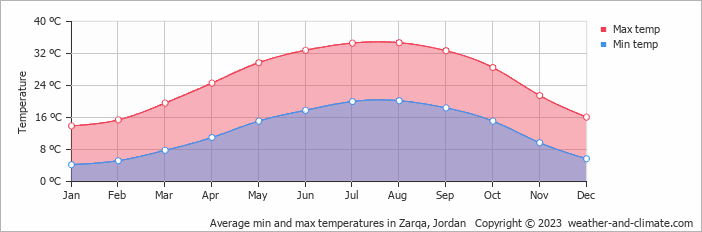
The climate in Zarqa, Zarqa Governorate, Jordan, is marked by large temperature swings across the seasons, ranging from 35°C (95°F) in August to 14°C (57°F) in January.
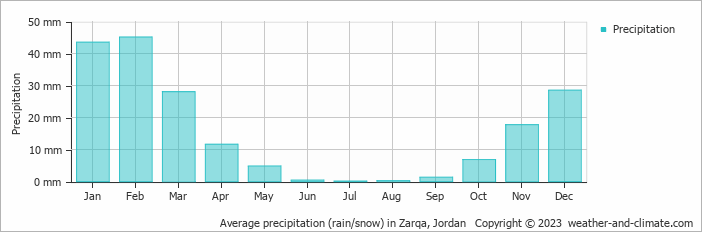
The city has an arid climate, receiving only 188 mm (7.4 in) of rainfall per year. Sunshine peaks in July, when the city sees around 12.9 hours of sunshine per day.
Monthly Temperature in Zarqa
In Zarqa, temperatures differ significantly between summer and winter months. On average, daytime temperatures range from a very warm 35°C (95°F) in August to a moderate 14°C (57°F) in January.
Nighttime temperatures range from 20°C (68°F) in August to 4°C (39°F) in January.
Check out our detailed temperature page for more information.
Temperature ranges by month
Rainfall in Zarqa
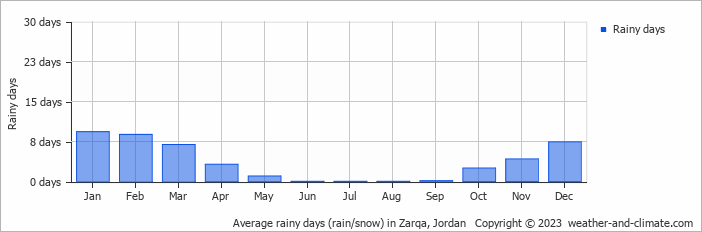
Zarqa sits in an arid zone with minimal moisture, averaging 188 mm (7.4 in) of rainfall per year. The seasons in Zarqa bring significant changes in precipitation. The wettest month, February, receives moderate rainfall, with an average of 45 mm (1.8 in) of precipitation. This rainfall is distributed across 9 rainy days.
In contrast, the driest month, July, experiences much less rainfall, totaling 0.1 mm (0 in) over 0 rainy days. These distinct seasonal differences provide diverse experiences throughout the year. For more details, please visit our Zarqa Precipitation page.
The mean monthly precipitation over the year, including rain, hail, and snow
The average number of days each month with precipitation
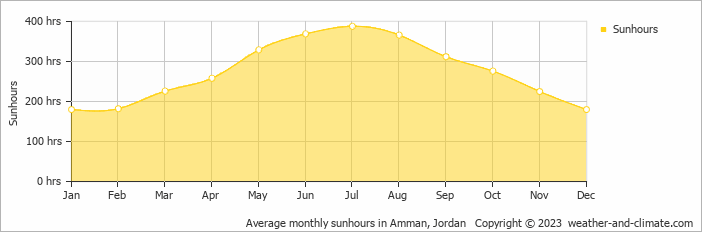
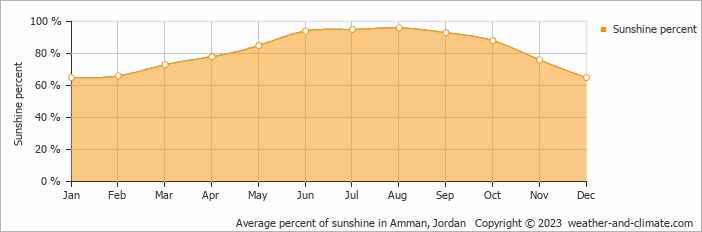
Sunshine Hours in Zarqa
In Zarqa, summer days are longer and more sunny, with daily sunshine hours peaking at 12.9 hours in July. As the darker season arrives, the brightness of the sun becomes less. January sees a soft sun for only 6.0 hours per average day.
Visit our detailed sunshine hours page for more information.
Monthly hours of sunshine
Daily hours of sunshine
Daily percentage of sunshine
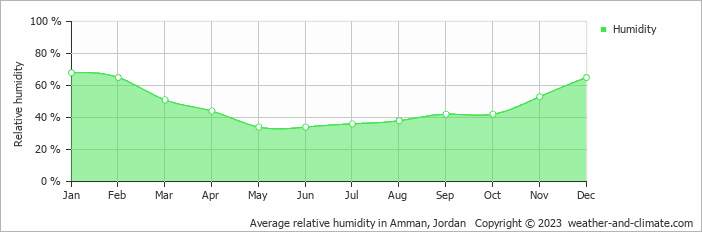
Humidity in Zarqa by Month
The relative humidity is moderate throughout the year in Zarqa.
The city experiences its highest humidity in January, reaching 68%. In May, the humidity drops to its lowest level at 34%. What does this mean? Read our detailed page on humidity levels for further details.
Relative humidity over the year
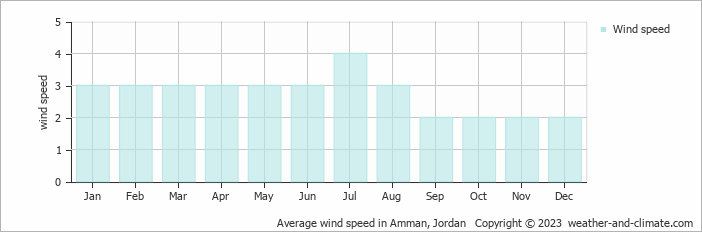
Wind Speed in Zarqa
The average wind speed over the year ranges from 2 m/s (4 knots) to 4 m/s (8 knots). It is lower in September, October, November and December and higher in July. What does this mean?
The mean monthly wind speed over the year (meters per second)
Zarqa 3-Day Forecast
Check the conditions for any month of the year.
Best Time to Visit Zarqa
The best time to visit Zarqa is during March, April, May, October and November, when the dry conditions provide ideal temperatures between 20°C (67°F) and 30°C (85°F). With minimal rainfall throughout the year, you can expect consistently clear, sunny days.While rain is rare, remember to stay hydrated and protect yourself from the sun while you're outside. Seeking the perfect travel destination for this year? We've created a tool that suggests locations matching your desired weather. Let our weather planner guide your travel decisions.