Wadi Rum Weather & Climate: Best Time to Visit
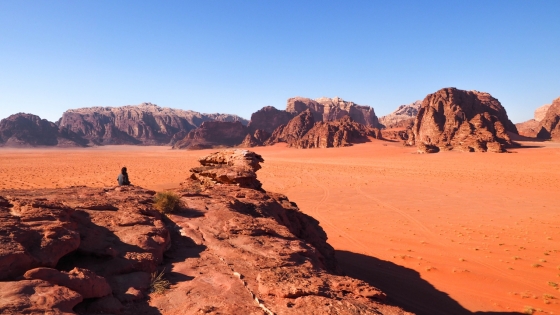
Wadi Rum is a desert area in southwestern Jordan. It is one of the country's main tourist attractions, with most visitors coming for a multi-day jeep or camel safari. Those who take part in extended trips stay overnight in Bedouin tents, as there are no hotels in the area.
Wadi Rum has a warm desert climate, marked by large temperature fluctuations and low rainfall. In the summer months, the average temperature is around 30°C (86°F), with nights about 10 degrees cooler. Winters are much cooler, with daytime temperatures around 10°C (50°F) to 15°C (59°F) and nights just above freezing. During the coldest nights of the year, frost is common.
Monthly Temperature in Wadi Rum
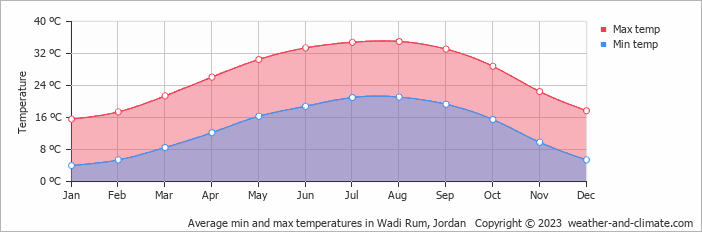
Depending on the time of the year, temperatures range from very hot to moderate in Wadi Rum. Average daytime temperatures reach a very hot 35°C (95°F) in August. In January, the coolest month of the year, temperatures drop to a moderate 16°C (61°F).
At night, temperatures range from around 21°C (70°F) in August to 4°C (39°F) in January.
Check out our detailed temperature page for more information.
Temperature ranges by month
Rainfall in Wadi Rum
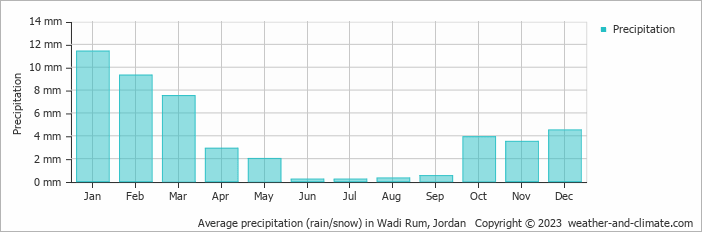
Wadi Rum has a dry climate with very low precipitation, averaging 46 mm (1.8 in) of rainfall annually. Despite minor fluctuations, Wadi Rum enjoys fairly consistent precipitation throughout the year. In January, you can expect around 11 mm (0.4 in) of precipitation, while in June, Wadi Rum receives about 0.2 mm (0.01 in). For more details, please visit our Wadi Rum Precipitation page.
The mean monthly precipitation over the year, including rain, hail, and snow
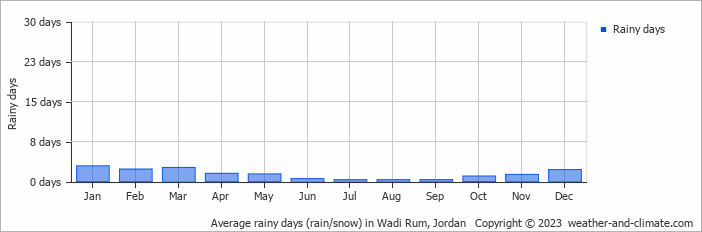
The average number of days each month with precipitation
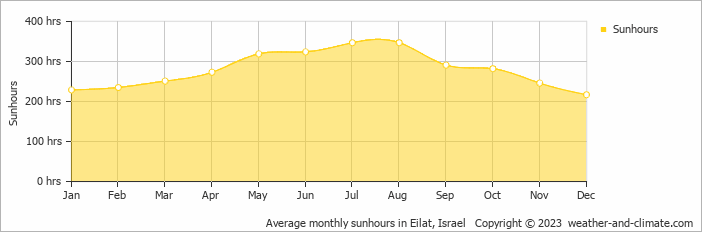
Sunshine Hours in Wadi Rum
Wadi Rum experiences moderate variation in sunshine hours across the seasons. With 11.6 hours daily sunshine in July, it dips to 7.2 hours in December, offering a balanced mix of sunny and overcast days.
Visit our detailed sunshine hours page for more information.
Monthly hours of sunshine
Daily hours of sunshine
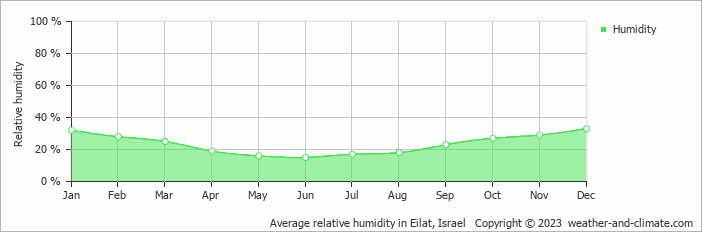
Humidity in Wadi Rum by Month
The relative humidity is low throughout the year in Wadi Rum.
The city experiences its highest humidity in December, reaching 33%. In June, the humidity drops to its lowest level at 15%. What does this mean? Read our detailed page on humidity levels for further details.
Relative humidity over the year
Wadi Rum 3-Day Forecast
Check the conditions for any month of the year.
Best Time to Visit Wadi Rum
Wadi Rum experiences very dry conditions with clear, sunny skies during March, April, October and November, when temperatures range from 21°C (71°F) to 29°C (84°F). These months offer the most pleasant conditions for exploring the area, with virtually no rainfall.The consistently dry weather means you can step outside without worrying about rain, though remember to carry water and sun protection. Ready to plan your travels but need destination ideas? Our smart tool recommends places based on the climate conditions you prefer. Start planning with our destination weather tool.