Valdivia Weather & Climate: Best Time to Visit
Average temperatures, rainfall, sunshine and the best time to visit Valdivia.
Climate overview of Valdivia
Valdivia, Los Rios, Chile, sees big temperature differences between seasons, with February peaking at 23°C (73°F) and July dropping to 12°C (54°F).
Rainfall is high, totalling around 1856 mm (73 in) per year. June is the wettest month and January the driest. The city also experiences a distinct rainy season from May to August. Sunshine peaks in January, when the city sees around 9.5 hours of sunshine per day.
Valdivia Weather by Month
Pick a month to see the average temperature, rainfall and sunshine in Valdivia — and find the best time to visit.
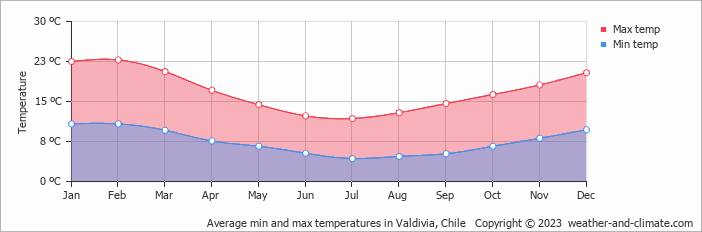
Monthly Temperature in Valdivia
Visitors to Valdivia can expect significant temperature changes throughout the year. Average maximum daytime temperatures range from a comfortable 23°C (73°F) in February, the warmest time of the year, to a chilly 12°C (54°F) during cooler months like July.
At night, you can expect temperatures ranging from 11°C (52°F) in February to around 4°C (39°F) during July.
Check out our detailed temperature page for more information.
Temperature ranges by month
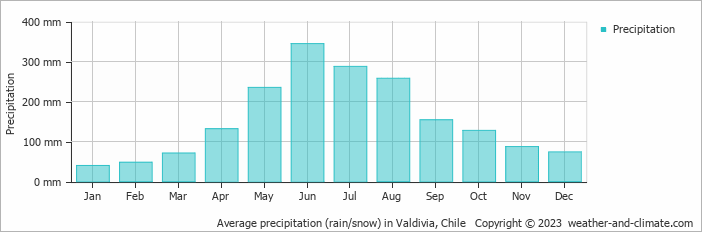
Rainfall in Valdivia
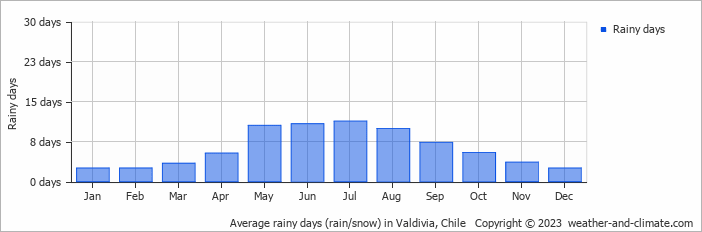
Valdivia is known for its substantial rainfall, with annual precipitation reaching 1856 mm (73 in). Significant seasonal changes in precipitation occur throughout the year. In the wettest month, June it receives heavy rainfall, averaging 344 mm (14 in) of precipitation, recorded across 11 rainy days. In contrast, the driest month January brings less rainfall, with 40 mm (1.6 in) over 3 rainy days. For more details, please visit our Valdivia Precipitation page.
The mean monthly precipitation over the year, including rain, hail, and snow
The average number of days each month with precipitation
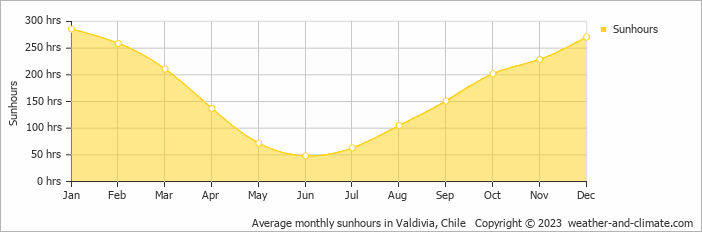
Sunshine Hours in Valdivia
Seasonal changes in sunshine hours are quite dramatic in Valdivia. While January receives considerable daily sunshine with up to 9.5 hours, June marks the darkest time of the year, where sunshine is scarce with only 1.6 hours of sunlight per day.
Visit our detailed sunshine hours page for more information.
Monthly hours of sunshine
Daily hours of sunshine
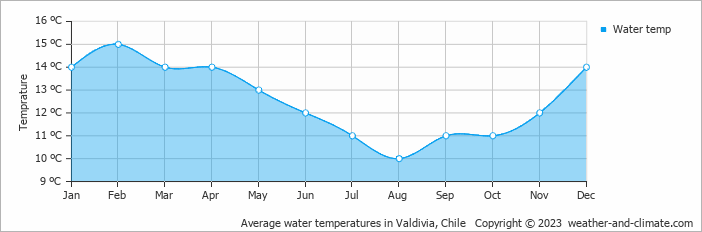
Water Temperature in Valdivia
The mean water temperature over the year ranges from 10°C (50°F) in August to 15°C (59°F) in February.
Water temperature over the year
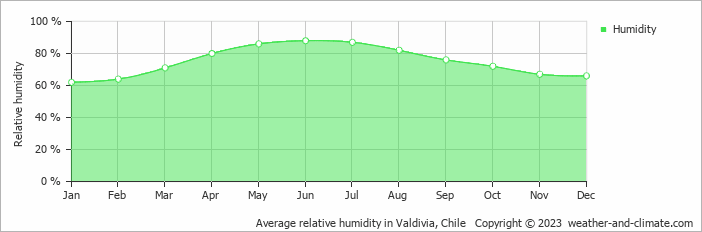
Humidity in Valdivia by Month
The relative humidity is high throughout the year in Valdivia.
The city experiences its highest humidity in June, reaching 88%. In January, the humidity drops to its lowest level at 62%. What does this mean? Read our detailed page on humidity levels for further details.
Relative humidity over the year
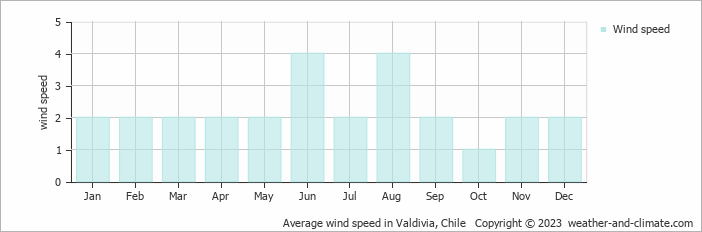
Wind Speed in Valdivia
The mean wind speed varies between 1 m/s (2 knots) and 4 m/s (8 knots) throughout the year. It is lowest in October and highest during June and August. What does this mean?
The mean monthly wind speed over the year (meters per second)
Best Time to Visit Valdivia
The weather does bring rainfall during this period, between 40 mm (1.6 in) and 87 mm (3.4 in).
Plan accordingly for May, June, July and August, when conditions bring the heaviest precipitation. Seeking the perfect travel destination for this year? We've created a tool that suggests locations matching your desired weather. Let our weather planner guide your travel decisions.
Frequently asked questions about the climate in Valdivia
What is the best time to visit Valdivia?
January, February, March and December typically offer the most optimal weather in Valdivia. In contrast, May, June, July and August tend to have less optimal conditions. Valdivia has a distinct rainy season from May to August.
What temperatures can I expect in Valdivia?
Daytime highs range from 12°C (54°F) in July to 23°C (73°F) in February. Nighttime lows range from 4°C (39°F) to 11°C (52°F). Temperatures vary considerably through the year.
How much rain does Valdivia get?
Annual rainfall is around 1856 mm (73 in). June is the wettest month with 344 mm (14 in), while January is the driest with 40 mm (1.6 in).
How sunny is Valdivia?
Valdivia receives around 2,034 hours of sunshine per year. January is the sunniest month with 286 hours, while June is the cloudiest with just 48 hours. Overall, Valdivia enjoys abundant sunshine.
Valdivia 3-Day Forecast
Valdivia 3-Day Forecast
Valdivia on the map
Valdivia is highlighted — select any city to see its climate.
Popular this month
Where to go in July — average daytime high across popular destinations.
Bucket list
Need travel inspiration? Check out our bucket list articles and be inspired.
 The 10 most alternative cities in South America
Discover South America's top 10 alternative cities! From Valparaíso's vibrant streets to La Paz's high-altitude charm and Medellín's innovative spirit.
 Torres del Paine
Torres del Paine is an huge national park on the border with Argentina. It is possible to walk here along craters, high-rising mountain ridges, over glaciers and through vast majestic tundra.
Explore Patagonia
A tour through Patagonia brings you to the end of the world. That’s why Patagonia is a bucket list destination for many. We recommend to visit Patagonia from November to early March.
Enjoy the silence and peace in a spectacular landscape
This lodge guarantees privacy and exclusivity for those seeking to get away from mass tourism and enjoy the silence and peace in a spectacular landscape.