
















 Tanzania in July: Zanzibar, Safari or Kilimanjaro?
Compare Tanzania weather in July for Zanzibar, Nungwi, Jambiani, Dar es Salaam and Moshi to plan a beach, safari or Kilimanjaro trip.
Average temperatures, rainfall, sunshine and the best time to visit Tabora.
 –
–
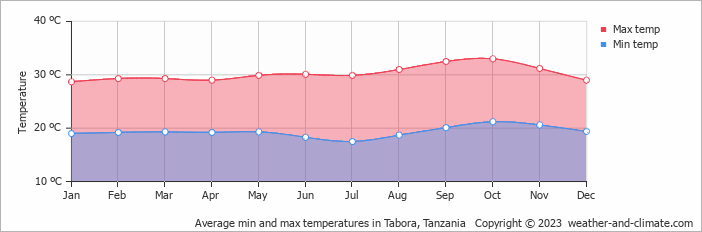
With consistently stable weather, Tabora, Tanzania, sees little seasonal temperature change. Daytime highs average 30°C (86°F), ranging from 33°C (91°F) in October to 29°C (84°F) in January.
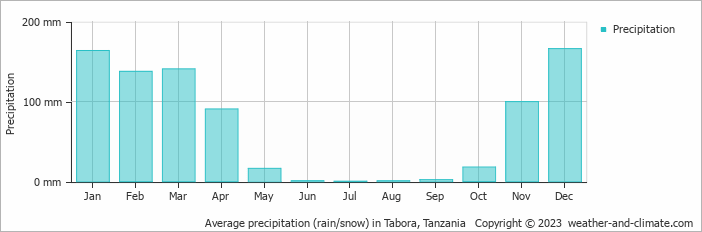
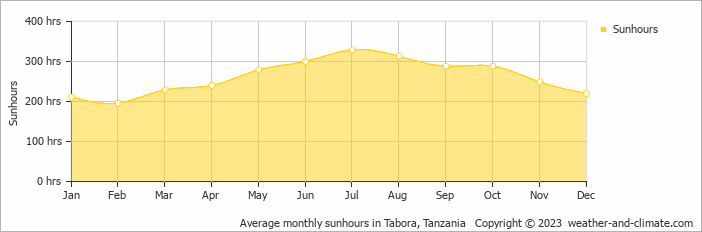
Tabora sees a moderate amount of rainfall, totalling around 835 mm (33 in) per year. It experiences a distinct dry season from May to October, creating some seasonal variation. The most sunshine falls in July, with an average of 11.0 hours of daily sunshine.
Pick a month to see the average temperature, rainfall and sunshine in Tabora - and find the best time to visit.
The climate in Tabora remains fairly constant, offering very warm temperatures throughout the year. Average maximum daytime temperatures range from a very warm 33°C (91°F) in October, the warmest time of the year, to a comfortable 29°C (84°F) during cooler months like January.
At night, you can expect temperatures ranging from 21°C (70°F) in October to around 18°C (64°F) during January.
Check out our detailed temperature page for more information.
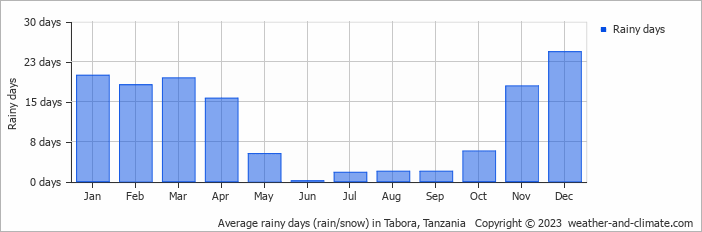
Generally, Tabora experiences moderate precipitation patterns, averaging 835 mm (33 in) yearly. Significant seasonal changes in precipitation occur throughout the year. In the wettest month, December it receives heavy rainfall, averaging 166 mm (6.5 in) of precipitation, recorded across 24 rainy days. In contrast, the driest month July brings less rainfall, with 0.2 mm (0.01 in) over 2 rainy days. For more details, please visit our Tabora Precipitation page.
Seasonal changes in sunshine hours are quite dramatic in Tabora. While July receives considerable daily sunshine with up to 11.0 hours, February marks the darkest time of the year, where sunshine is scarce with only 6.5 hours of sunlight per day.
Visit our detailed sunshine hours page for more information.
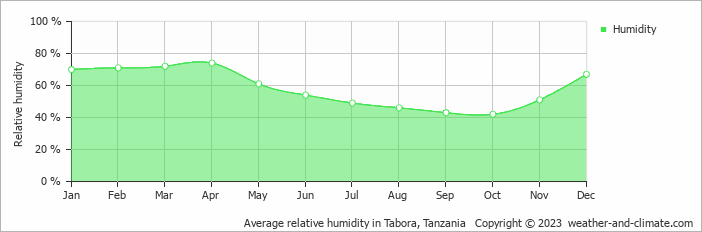
The relative humidity is moderate throughout the year in Tabora.
The city experiences its highest humidity in April, reaching 74%. In October, the humidity drops to its lowest level at 42%. What does this mean? Read our detailed page on humidity levels for further details.
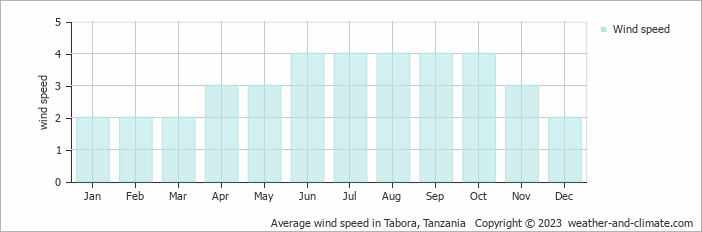
The mean wind speed varies between 2 m/s (4 knots) and 4 m/s (8 knots) throughout the year. It is lowest in January, February, March and December and highest during June, July, August, September and October. What does this mean?
Monthly ratings reflect general weather comfort, based on daytime temperature and rainfall. Swimming and winter conditions are highlighted separately where relevant.
April typically offers the most optimal weather in Tabora. In contrast, November tends to have less optimal conditions. Tabora has a distinct dry season from May to October.
Daytime highs range from 29°C (84°F) in January to 33°C (91°F) in October. Nighttime lows range from 18°C (64°F) to 21°C (70°F). Temperatures stay relatively stable year-round.
Annual rainfall is around 835 mm (33 in). December is the wettest month with 166 mm (6.5 in), while July is the driest with 0.2 mm (0.01 in).
Tabora receives around 3,142 hours of sunshine per year. July is the sunniest month with 329 hours, while February is the cloudiest with just 196 hours. Overall, Tabora enjoys abundant sunshine.
Tabora is highlighted - select any city to see its climate.
Where to go in October - average daytime high across popular destinations.
Dar es Salaam 31°C (88°F) Bwejuu29°C (84°F) Zanzibar City30°C (86°F) Matemwe28°C (82°F) Paje29°C (84°F) Jambiani29°C (84°F) Nungwi28°C (82°F) Moshi27°C (81°F)
 Need travel inspiration? Check out our bucket list articles and be inspired.
Tanzania in July: Zanzibar, Safari or Kilimanjaro?
Compare Tanzania weather in July for Zanzibar, Nungwi, Jambiani, Dar es Salaam and Moshi to plan a beach, safari or Kilimanjaro trip.
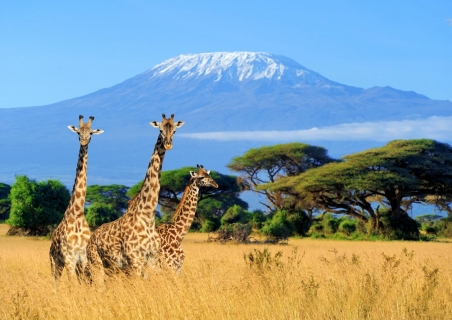 Climb the Kilimanjaro
The Kilimanjaro with its 5895 meters (19340 ft) is the roof of Africa. Climbing Kilimanjaro is a crazy experience and if you like adventure it’s an absolute must for the bucket list.
 The Serengeti
The Serengeti has wide, unending grasslands and is known for its spectacular sunsets. The park also offers the biggest wildlife population in the whole of Africa.
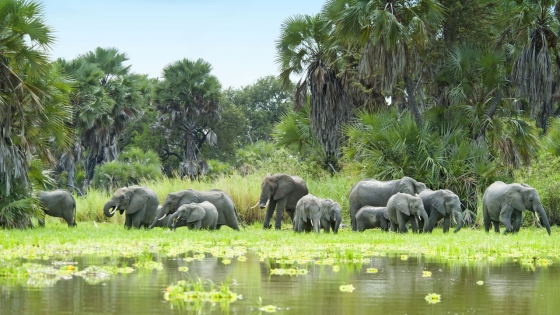 Walk Safari In the Selous Game Reserve
We feel the Selous Game Reserve is undoubtedly one of the most beautiful nature reserves in Tanzania and we recommend adding it to your bucket list. Here you can still experience the real Africa.