Diego Ramírez Islands Weather & Climate: Best Time to Visit
Average temperatures, rainfall, sunshine and the best time to visit Diego Ramírez Islands.
Climate overview of Diego Ramírez Islands
Diego Ramírez Islands, Antofagasta Region, Chile, enjoys a steady climate throughout the year, with daytime temperatures typically around 8°C (46°F). February is the warmest month at 10°C (50°F), while July is the coolest at 7°C (45°F).
With around 1496 mm (59 in) of annual rain/snowfall, Diego Ramírez Islands has a notably wet climate. The wettest month is April.
Diego Ramírez Islands Weather by Month
Pick a month to see the average temperature, rainfall and sunshine in Diego Ramírez Islands — and find the best time to visit.
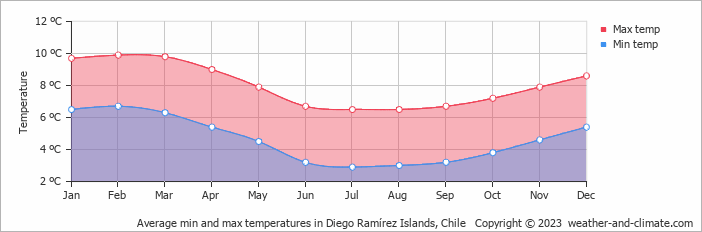
Monthly Temperature in Diego Ramírez Islands
The temperature in Diego Ramírez Islands remains steady throughout the year, providing a consistently chilly climate. Average daytime temperatures reach a chilly 10°C (50°F) in February. In July, the coolest month of the year, temperatures drop to a chilly 7°C (45°F).
At night, temperatures range from around 7°C (45°F) in February to 3°C (37°F) in July.
Check out our detailed temperature page for more information.
Temperature ranges by month
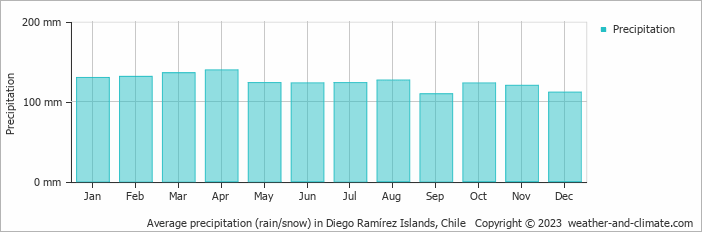
Rainfall in Diego Ramírez Islands
Diego Ramírez Islands has a relatively rain/snowy climate with high precipitation levels, averaging 1496 mm (59 in) of rain/snowfall annually. Despite minor fluctuations, Diego Ramírez Islands enjoys fairly consistent precipitation throughout the year. In April, you can expect around 139 mm (5.5 in) of precipitation, while in September, Diego Ramírez Islands receives about 109 mm (4.3 in). For more details, please visit our Diego Ramírez Islands Precipitation page.
The mean monthly precipitation over the year, including rain, hail, and snow
The average number of days each month with precipitation

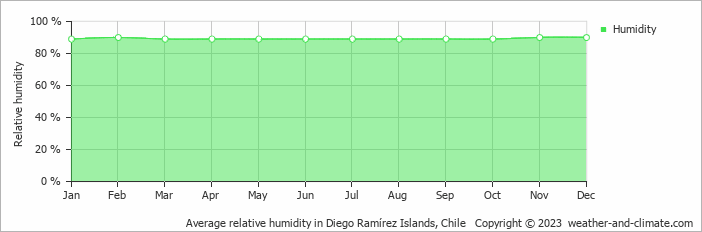
Humidity in Diego Ramírez Islands by Month
The city experiences its highest humidity in February, reaching 90%. In January, the humidity drops to its lowest level at 89%. What does this mean? Read our detailed page on humidity levels for further details.
Relative humidity over the year
Best Time to Visit Diego Ramírez Islands
Check the specific monthly conditions to plan your visit according to your weather preferences and planned activities. Wondering where to travel based on your weather preferences? Our recommendation tool helps you find destinations with your ideal climate conditions. Use our weather planner to find your perfect destination.
Frequently asked questions about the climate in Diego Ramírez Islands
What temperatures can I expect in Diego Ramírez Islands?
Daytime highs range from 7°C (45°F) in July to 10°C (50°F) in February. Nighttime lows range from 3°C (37°F) to 7°C (45°F). Temperatures stay relatively stable year-round.
How much rain does Diego Ramírez Islands get?
Annual rainfall is around 1496 mm (59 in). April is the wettest month with 139 mm (5.5 in), while September is the driest with 109 mm (4.3 in).
Diego Ramírez Islands 3-Day Forecast
Diego Ramírez Islands 3-Day Forecast
Diego Ramírez Islands on the map
Diego Ramírez Islands is highlighted — select any city to see its climate.
Popular this month
Where to go in July — average daytime high across popular destinations.
Bucket list
Need travel inspiration? Check out our bucket list articles and be inspired.
 The 10 most alternative cities in South America
Discover South America's top 10 alternative cities! From Valparaíso's vibrant streets to La Paz's high-altitude charm and Medellín's innovative spirit.
 Torres del Paine
Torres del Paine is an huge national park on the border with Argentina. It is possible to walk here along craters, high-rising mountain ridges, over glaciers and through vast majestic tundra.
Explore Patagonia
A tour through Patagonia brings you to the end of the world. That’s why Patagonia is a bucket list destination for many. We recommend to visit Patagonia from November to early March.
Enjoy the silence and peace in a spectacular landscape
This lodge guarantees privacy and exclusivity for those seeking to get away from mass tourism and enjoy the silence and peace in a spectacular landscape.