Caravelas Weather & Climate: Best Time to Visit
Average temperatures, rainfall, sunshine and the best time to visit Caravelas.
Climate overview of Caravelas
Caravelas, Brazil, has a stable climate with little temperature variation across the year. Average daytime temperatures hover around 28°C (82°F), peaking in February at 30°C (86°F) and dipping in July to 26°C (79°F).
The city receives considerable rainfall, with around 1112 mm (44 in) annually. November is the wettest month. January is the sunniest month, averaging 8.1 hours of sunshine per day.
Caravelas Weather by Month
Pick a month to see the average temperature, rainfall and sunshine in Caravelas — and find the best time to visit.
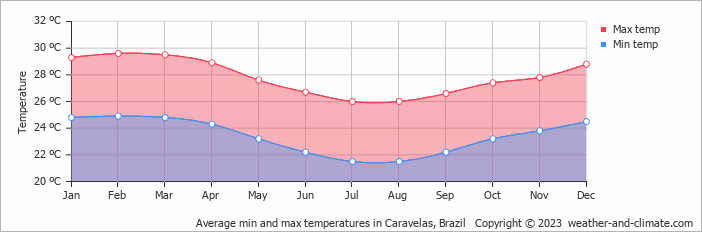
Monthly Temperature in Caravelas
With minimal seasonal shifts, Caravelas experiences a constant climate year-round. Typically, average maximum daytime temperatures range from a comfortable 30°C (86°F) in February to a comfortable 26°C (79°F) in the coolest month, July.
Nights vary from 25°C (77°F) in February to around 22°C (72°F) during the colder months.
Check out our detailed temperature page for more information.
Temperature ranges by month
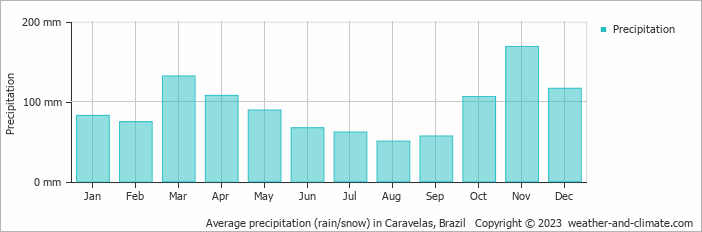
Rainfall in Caravelas
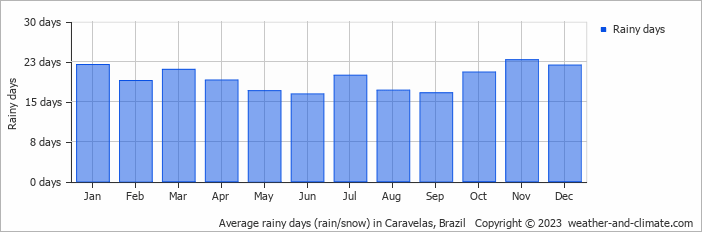
Caravelas has a notably wet climate with abundant precipitation, recording 1112 mm (44 in) of rainfall per year. The climate in Caravelas shows significant variation throughout the year. Expect heavy rainfall in November, the wettest month, with an average of 169 mm (6.7 in) of precipitation over 23 rainy days.
In contrast, the driest month August offers drier and sunnier days, with around 50 mm (2 in) of rainfall over 17 rainy days. For more details, please visit our Caravelas Precipitation page.
The mean monthly precipitation over the year, including rain, hail, and snow
The average number of days each month with precipitation
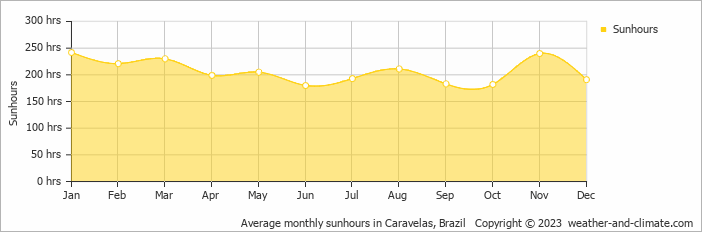
Sunshine Hours in Caravelas
Caravelas offers a pleasant mix of sunny and slightly overcast days. The difference in sunshine hours between January (8.1 hours daily) and June (6.0 hours daily) provides a bit of variety for visitors and residents.
Visit our detailed sunshine hours page for more information.
Monthly hours of sunshine
Daily hours of sunshine
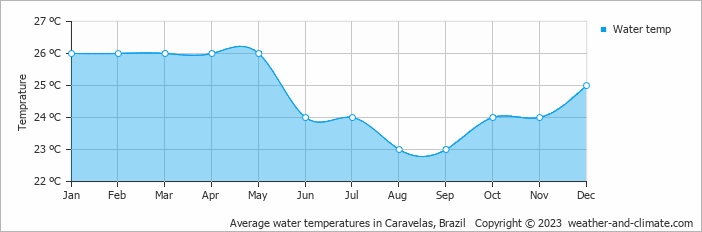
Water Temperature in Caravelas
The mean water temperature over the year ranges from 23°C (73°F) in August to 26°C (79°F) in January.
Water temperature over the year
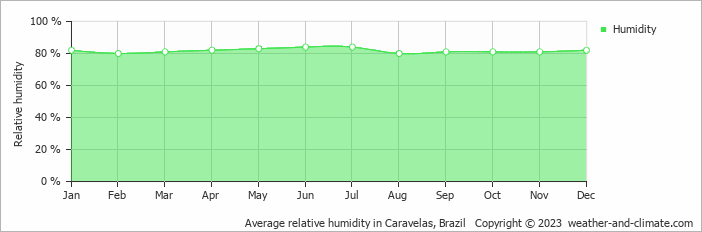
Humidity in Caravelas by Month
The city experiences its highest humidity in June, reaching 84%. In February, the humidity drops to its lowest level at 80%. What does this mean? Read our detailed page on humidity levels for further details.
Relative humidity over the year
Best Time to Visit Caravelas
The wettest months are November, when precipitation is at its highest. Wondering where to travel based on your weather preferences? Our recommendation tool helps you find destinations with your ideal climate conditions. Use our weather planner to find your perfect destination.
Frequently asked questions about the climate in Caravelas
What is the best time to visit Caravelas?
January, May, June, July, August and September typically offer the most optimal weather in Caravelas. In contrast, March tends to have less optimal conditions.
What temperatures can I expect in Caravelas?
Daytime highs range from 26°C (79°F) in July to 30°C (86°F) in February. Nighttime lows range from 22°C (72°F) to 25°C (77°F). Temperatures stay relatively stable year-round.
How much rain does Caravelas get?
Annual rainfall is around 1112 mm (44 in). November is the wettest month with 169 mm (6.7 in), while August is the driest with 50 mm (2 in).
How sunny is Caravelas?
Caravelas receives around 2,477 hours of sunshine per year. January is the sunniest month with 242 hours, while June is the cloudiest with just 180 hours. Overall, Caravelas enjoys abundant sunshine.
Caravelas 3-Day Forecast
Caravelas 3-Day Forecast
Caravelas on the map
Caravelas is highlighted — select any city to see its climate.
Popular this month
Where to go in June — average daytime high across popular destinations.
Bucket list
Need travel inspiration? Check out our bucket list articles and be inspired.
 The 10 most alternative cities in South America
Discover South America's top 10 alternative cities! From Valparaíso's vibrant streets to La Paz's high-altitude charm and Medellín's innovative spirit.
 The 5 most tranquil retreats in the Amazon Rainforest, Brazil
Discover top sustainable lodges in the Amazon. Enjoy unique wildlife, eco-friendly stays, and immersive experiences at Anavilhanas, Cristalino, and more.
An alternative way to discover Rio de Janeiro
Don't feel like seeing the traditional tourist sights in Rio de Janeiro? We have made an overview of the sights in Rio de Janeiro that you must see if you want to visit Rio in an alternative way.
Iguazu Falls
Iguazu Falls are among the largest waterfalls on earth. You will be speechless when you see this miracle of mother nature. They are included in the World Heritage List and have also been named one of the seven wonders of the world.